
keirarae2005
24.08.2019 •
Mathematics
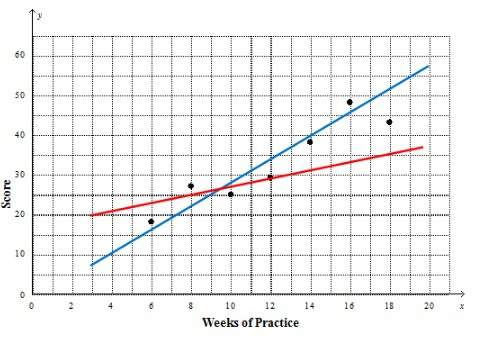
1. which line models the data points better and why?
blue, because it's longer
blue, because the data points are all close to the line
red, because it goes through one of the points
red, because there are three points above the line and three points below the line
2. according to the blue line, what would you estimate the score was after 3 weeks of practice?
about 40
about 18
about 8
about 22
3.according to the blue line, about how many weeks of practice are required to achieve a score of 50?
15 weeks
17 weeks
19 weeks
21 weeks
Solved
Show answers
More tips
- C Computers and Internet How to Format Your C Drive: Detailed Guide and Tips...
- F Food and Cooking How to Properly Cook Buckwheat?...
- F Food and Cooking How Many Grams Are In a Tablespoon?...
- L Leisure and Entertainment Carving: History and Techniques for Creating Vegetable and Fruit Decorations...
- P Photography and Videography How to Choose the Perfect Photo Paper for Your Images?...
- H Health and Medicine What vaccines do children need?...
- H Health and Medicine Reasons for the Appearance of Warts: Everything You Need to Know...
- A Art and Culture How to Learn Screaming: Step-by-Step Guide for Beginners...
- H Health and Medicine Contraceptive Pills After 35: The Importance Of Choosing The Right Medication...
- C Computers and Internet How to Choose a Monitor?...
Answers on questions: Mathematics
- M Mathematics Can someone please help with this question?...
- M Mathematics 1 5/8 ,1 1/2 ,1 3/4 , 7/16 Which shows the numbers/fractions in order from smallest to largest?...
- M Mathematics The equation of line P is Y equals -7 divided by X +6 line Q is perpendicular to pee what is the slope of line Q...
- B Business Phân tích phong cách lãnh đạo của Hùng...
- H History How should i define life liberty and pursuing of happiness?...
Ответ:
Answer with explanation:
Ques 1)
The line that models the data better is:
Line Blue.
( Since the data is best modeled with the help of line along which the data points are uniformly scattered.
In line Red the data points are far away from the line so this does not give a good representation of the data)
Blue, because the data points are all close to the line.
Ques 2)
According to the blue line, the estimate score after 3 weeks of practice.
About 8.
Ques 3)
Now to achieve a score of 50 according to blue line about seventeen weeks are required.
17 weeks.
Ответ: