
alimfelipe
31.03.2021 •
Mathematics
$270,000
$250,000
$230,000
$210,000
$190,000
$170,000
$150,000
1999 2000 2001 2002 2003 2004 2005 2006 2007 2008 2009 2010
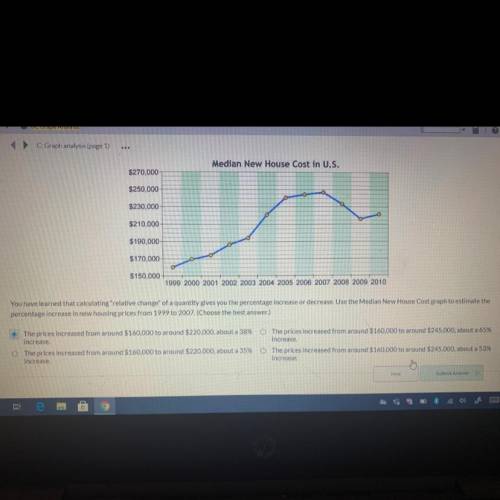
You have learned that calculating relative change of a quantity gives you the percentage increase or decrease. Use the Median New House Cost graph to estimate the
percentage increase in new housing prices from 1999 to 2007. (Choose the best answer.)
O The prices increased from around $160.000 to around $220,000, about a 38%
increase.
The prices increased from around $160,000 to around $220,000, about a 35%
increase.
The prices increased from around $160,000 to around $245,000, about a 65%
increase.
The prices increased from around $160,000 to around $245.000 about a 53%
increase
Solved
Show answers
More tips
- T Travel and tourism How to Use a Compass: A Beginner s Guide...
- C Computers and Internet Porn Banner: What It Is and How to Get Rid Of It?...
- F Food and Cooking How many stages of coffee roasting are there?...
- F Food and Cooking From Latte to Espresso: Which Coffee Drink is the Most Popular on Earth?...
- F Food and Cooking Experts Name Top 5 Healthiest Teas...
- C Computers and Internet Google Search Tips and Tricks: Everything You Need to Know...
- H Health and Medicine Discover the Hidden Principles and Real Results of the Japanese Diet...
- H Health and Medicine Liver Cleansing - Rejuvenation for the Body?...
- S Style and Beauty Is Photoepilation the Solution to Unwanted Hair Forever?...
- S Style and Beauty Unbelievable Hairstyles for Long Hair - 2021 Trends...
Answers on questions: Mathematics
- M Mathematics Merlin industries bought a laptop for $2,100. it is expected to depreciate at a rate of 14% per year. what will the value of the laptop be in 5 years? round to the nearest dollar....
- M Mathematics √17 is between 16 and 18? true or false...
- M Mathematics If the factorization of the expression x^2+kx+15 is (x-3)(x-5) what is the value of k...
- M Mathematics Locate a point in Quadrant IV of the coordinate plane. Label the point B, and write its ordered pair next to it....
- M Mathematics Someone help me with this worksheet. Only 3 questions. Will give brainliest!!!...
- M Mathematics Please look at the images below. (I will mark you as Brainliest if you are correct!)...
- M Mathematics Factor the trinomial below. x^2+4x-12...
- M Mathematics Help please thank you...
- M Mathematics Which of the following equations are true? Select three that apply. A. 7 × 1 2 = 31 2 B. 2 3 × 5 = 10 15 C. 2 × 3 4 = 23 4 D. 4 5 × 2 = 16 5 E. 3 × 5 6 = 15 6 F. 6 7 × 7 = 6...
- M Mathematics Is f(x)=1/3(-9/2)^x an exponential decay...
Ответ:
Step-by-step explanation:
Given the table:
Month f(x) = Number of imports g(x) = Number of exports
January (1) 3 1
February (2) 4 3
March (3) 5 5
April (4) 6 7
From the table, it is clear that:
Number of imports = number of month + 2
so
also
Number of exports = 2(number of month) + 1
so
Therefore, number of imports equals the number of month plus one. i.e. , which is a linear function.
If we compare it with slope-intercept form of the line
Then,
slope = m = 1
y-intercept = 2
Also number of exports equals is also a linear function.
i.e.
Here,
slope = m = 2
y-intercept = -1