
kaitlyn7077
12.08.2020 •
Mathematics
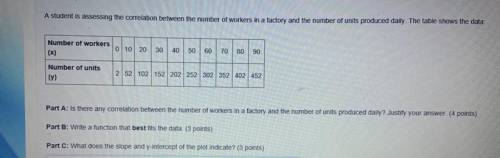
A student is assessing the correlation between the number of workers in a factory and the number of units produced daily. The table shows the data: GRAPH IS LOCATED IN PICTURES! Part A: Is there any correlation between the number of workers in a factory and the number of units produced daily? Justify your answer. (4 points) Part B: Write a function that best fits the data. (3 points) Part C: What does the slope and y-intercept of the plot indicate? (3 points)
Solved
Show answers
More tips
- C Computers and Internet Best iPad Games: Our Opinion...
- A Animals and plants Man s Best Friend: Which Dog Breed Is the Most Friendly?...
- H Health and Medicine 10 Simple Techniques on How to Boost Your Mood...
- G Goods and services How to Choose the Right High Chair for Your Baby?...
- S Style and Beauty Learn how to tie a keffiyeh on your head like a pro...
- S Style and Beauty How to braid friendship bracelets?...
Answers on questions: Mathematics
- M Mathematics Identify the slope of the line shown in the graph below: a.slope = 1 b.slope = 0 c.slope = 4 d.slope = undefined...
- M Mathematics Basic geometric concepts: tutorial oner evaluation or your work 15 of 22 e save & exit rintable rtificate activity use geogebra to explore the properties of perpendicular...
- M Mathematics We have a jar of coins, all pennies and dimes. all together, we have 309 coins, and the total value of all coins in the jar is $ 19.2. how many pennies are there in the jar?...
- M Mathematics Curtis decided to go on a road trip to canada. on the first day of his trip, he drove for 11 hours and traveled 715 miles. at what rate did he travel on the first day, in miles...
- M Mathematics Beelearning | elearningflvs loginpalm beach portal l.q left1207300_liberal arts_math_1_52_2017the graph of the function fox) = (x-4)(x + 1) is shownbelowwhich statement about...
- M Mathematics Click an item in the list or group of pictures at the bottom 2x^3-4x^2+6x-3...
- M Mathematics X- z=7 x+y=3 z- y=6 for the above system of three equations, x = (a) 5 (b) 6 (c) 7 (d) 8 (e) 9...
- M Mathematics Belearning cleaning flvs loginpalm beach portal l.qleft1207300_liberal arts math_1_s2_2017englishwhich statement about the function is true? the graph of the function f(x) =...
- M Mathematics For a line that goes through points (2,-2) and (1.-6), what is the equationof the line in point-slope form?...
- M Mathematics Given variables a, b and c. the value of c is three more than the value of b. the value of a is four times the value of b and two times the value of c. what is the value of...
Ответ:
Which is