
scarlettlackey
16.10.2020 •
Mathematics
An environmental engineer is tasked with determining whether a power plant cooling system is heating the water it uses more than allowed by environmental regulations. They measure water temperatures at the cooling system input and the cooling system output for several different days in several different seasons. A list containing these measurements is below:
Sample Input Temp (deg F) Output Temp (deg F)
1 57.6 65.1
2 68.9 74.4
3 68.1 74.7
4 47.7 55.4
5 48.1 51
6 67.2 71.9
7 69.9 79.2
8 48.1 57.2
9 35 41.4
10 56 61
11 44.3 50.8
12 65 70.5
13 48.3 56.9
14 54.9 61.7
15 60.4 67.3
Do a statistical analysis on this data to determine if the temperature change between the input and output of the cooling system is different than 6 degrees.
1. What does your analysis indicate?
a. The cooling system changes the temperature of the water by an amount different than 6 degrees.
b. The cooling system changes the temperature of the water by 6 degrees.
2. What is the P-Value associated with your decision above?
a. 0.001
b. 0.026
c. 0.049
d. 0.070
e. 0.110
f. 0.131
g. 0.148
h. 0.201
i. 0.278
j. 0.289
Solved
Show answers
More tips
- A Art and Culture Who Said The Less We Love a Woman, the More She Likes Us ?...
- F Family and Home How to Get Rid of Your Neighbors?...
- S Society and Politics How Could Nobody Know About the Dead Mountaineers?...
- H Health and Medicine How to Cure Adenoids?...
- H Health and Medicine Why Wearing a Back Brace Can Be Beneficial During Back Strain?...
- S Sport When and Where Will the 2014 World Cup be Held?...
- C Computers and Internet How to Choose a Monitor?...
- H Horoscopes, Magic, Divination Where Did Tarot Cards Come From?...
- S Style and Beauty How to Make Your Lips Fuller? Ideas and Tips for Beautiful Lips...
Answers on questions: Mathematics
- M Mathematics What is the length of AB?...
- M Mathematics What is the mean number of games played? . . :. . : :4 5 6 7Games...
- C Computers and Technology Prepare a report dealing with the following topic; Write a java program that defines a one dimension array and do the following process in the program: Read value...
- M Mathematics Read the scenario and part 1-3 questions. write your answer in the space provided. teddy and henry both bought a used car on the same day. teddy’s used car has...
- H Health Conflict resolution includes all of the following except: a. negotiation and diplomacy between parties b. continued aggression between parties c. involvement and...
Ответ:
1
The correct option is b
2
The correct option is h
Step-by-step explanation:
From the question we are told that
The sample size is n = 15
The difference in population proportion is
Generally the sample mean of the input temperature is
=>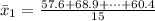
=>
Generally the sample mean of the output temperature is
=>
=>
Generally the difference of the sample mean of the input temperature and that of the output temperature is
=>
=>
Generally the standard deviation is mathematically represented as
=>![s_d = \sqrt{\frac{([57.6- 65.1]- 6.6)^2+ ([68.9 - 74.4]- 6.6)^2 + \cdots + ([60.4 - 67.3]- 6.6)^2 }{15} }](/tpl/images/0809/5811/66499.png)
=>![s_d = 1.732 [/texGenerally the test statistics is mathematically represented as [tex]t = \frac{ d - \= d }{ \frac{s_d}{\sqrt{n} } }](/tpl/images/0809/5811/baae3.png)
=>
=>
Generally the degree of freedom is mathematically represented as
=>
=>
Generally the probability of t obtained from the t - distribution table at a degree of freedom of is
is
Generally the p-value is mathematically represented as
=>
=>
From the values obtained we see that hence
hence
The decision rule is
Fail to reject the null hypothesis
The conclusion is
The cooling system changes the temperature of the water by 6 degrees.
Ответ:
f¹(x) = x - 3
To find the inverse of a function, just "trade" and y and solve for the "new" y. The graph of the inverse is the reflection of the original function over the line y = x.
Rewrite the function f(x) = x + 3
as the equation y = x + 3
Trade x and y.
x = y + 3
Solve for the "new" y.
= y + 3
3 - 3
Subtract 3 from both sides
y = x= 3
The symbol for the inverse is f-¹(x)
f¹(x) = x - 3
Step-by-step explanation:
brainlies me plss