
hannahpelkey
14.11.2020 •
Mathematics
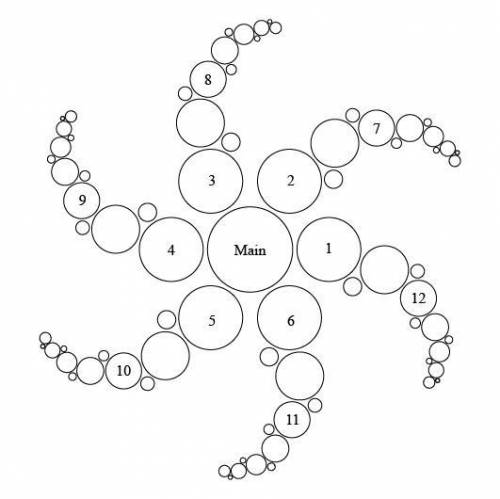
For decades, hoax artists have been going out into grain fields to make crop circles like the one shown below. Though many people believed these crop circles to be the work of aliens we now know that these designs were made by people with very simple tools and some geometric knowledge. To make each circle, one person stands stationary in a field holding a rope of a specific length, while another person holds the other end of the rope. The second person circles the first and uses a wooden plank to bend the grain stalks until all the grain in that circle lies flat against the ground. Then they both move to make other circles. The result is often very beautiful, especially when seen from the air. Along with the image below, Use your knowledge of the unit circle and radian measure of angles to answer the following questions. [Note: When the questions ask you to consider circles and their angle in relation to the main circle, the question is referring to the location of the center of each circle.]
a. Consider circles 1 through 6. If these circles are equally spaced around the main circle, and circle 1 is at 0°, what is the direction (in degrees) of each of these circles in relation to the main circle?
b. Consider circles 7 through 12. If circle 7 is at 45°, what is the radian measure of each of these circles in relation to the main circle? Explain how you know these values.
c. If the center of circle 3 is 100 feet away from the main circle, what are the coordinates of the center of circle 3 (the origin is at the center of the main circle)? Use these coordinates to prove that the distance from the centers of circle 3 and the main circle are 100 feet apart.
d. After creating the design, the designers want to inspect their work. They start at 0° and walk all the way around the design almost two times and stop at circle 12. How many radians did they cover during their inspection?
e. Consider circles 5 and 6. In relation to the main circles, do the center points of circles 5 and 6 have even or odd symmetry? Why?
Solved
Show answers
More tips
- C Computers and Internet How to Download Movies from Torrents?...
- F Food and Cooking How to Make the Perfect Glühwein: Step-by-Step Guide...
- A Animals and plants How to Grow Lime from a Seed: Simple Tips and Interesting Facts...
- S Style and Beauty How to Properly Tie a Tie: 5 Simple Steps...
- C Computers and Internet Dynamically Assigned IP Address: What Is It and How Does It Work?...
- C Computers and Internet How to Check the Speed of My Internet?...
- H Health and Medicine 5 Simple Steps to Quit Smoking for Good...
- C Computers and Internet How to Download Videos from YouTube? Simple Steps to Download Any Content...
- H Health and Medicine What is the Normal Blood Sugar Level in a Healthy Person?...
- S Style and Beauty How to Get Rid of Acne: Scientifically Proven Methods...
Answers on questions: Mathematics
- M Mathematics Simplify. 49/16 Be sure to write your answer in simplest form....
- M Mathematics Halle has 36 feathers, 48 acorns , and 60 agates...
- M Mathematics Find the two square roots of -24 - 10i...
- M Mathematics How does the percent equation help solve markup problems i will mark brainliest...
- M Mathematics One pound of candies costs $3.50. a) How much will we have to pay for 3 lb? b)How much will we have to pay for 4.5 lb? c)How many pound of candies can be bought for $7? d)How...
- M Mathematics Which number line model represents the sum of 1 1/2+(-1/2)...
- M Mathematics Please help? What’s a expression for the area of the shaded part...
- M Mathematics Freee points for everyone enjoy...
- M Mathematics Help plz i need help...
- M Mathematics HELP Use the graph to determine the solution of the inequality |x + 1| + 2 5....
Ответ:
idk
Step-by-step explanation:
Ответ:
all my points got deleted you can delet this answer if you want
Step-by-step explanation:
Ответ:
*The dot plot is shown in the attachment below
2
Step-by-step explanation:
Interquartile range is the difference between the upper median (Q3) and the lower median (Q1).
First, let's write out each value given in the data. Each dot represents a data point.
We have:
2, 3, 3, 4, 4, 4, 4, 5, 5, 6, 7
=>Find the median:
Our median is the middle value. The middle value is the 6th value = 4
==>Upper median Q3) = the middle value of the set of data we have from the median to our far right.
2, 3, 3, 4, 4, |4,| 4, 5, [5], 6, 7
Our upper median = 5
==>Lower median(Q1) = the middle value of the data set we have from our median to our far left.
2, 3, [3], 4, 4, |4,| 4, 5, 5, 6, 7
Lower median = 3
==>Interquartile range = Q3 - Q1 = 5-3 = 2