
gabriellarenolp5x7c0
03.02.2020 •
Mathematics
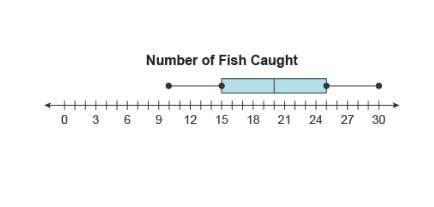
the box plot represents the number of fish that fishermen caught from a lake.
select all statements that are true for the data.
a) about 25% of the fishermen caught between 25 and 30 fish.
b) the spread is symmetrical about the median.
c) one fisherman caught no fish at all.
d) about 75% of the fishermen caught between 15 and 25 fish.
e) the range is 20 fish.
Solved
Show answers
More tips
- A Animals and plants How to Properly Care for a Pet Decorative Rabbit at Home?...
- G Goods and services What Useful Foods Can You Buy at Supermarkets?...
- F Food and Cooking How to Determine Healthy, Nutritious Food for Yourself?...
- A Art and Culture The History and Characteristics of Jazz Bands: A Deep Dive...
- W Work and Career Can Skill Alone Make You a Professional?...
- F Family and Home Daughter says: If you don t want to do it, don t do it. Should we persuade her?...
- S Science and Technology How to Secure Exam Sessions: Silence Mobile Phones in the Classroom...
- C Computers and Internet Which Phone is Best for Internet Surfing?...
- P Philosophy Is Everything We Strive for Eventually Achieved and Destroyed?...
- S Society and Politics Understanding Politics and Its Role in the Development of Civilization...
Answers on questions: Mathematics
- M Mathematics I will mark brainiest if right...
- M Mathematics The box plots show the average gas mileage, in miles per gallon, of cars and minivans tested by a certain company. Cars + + + + + 14 16 18 20 22 24 26 28 30 32 34 Minivans...
- M Mathematics The second number in an ordered pair of numbers that corresponds to a point on a coordinated system is the...
- H Health How would you verify that a normal body temperature is between ninety-eight to ninety-nine degrees fahrenheit?...
- M Mathematics One to one graph please help i’m stuck...
Ответ:
>Since the boxplot looks symmetric, the parts are each 25%.
B) The spread is symmetrical about the median.
>The median is 20.
20-15 = 5; 15-10 = 5
25-20 = 5; 30-25 = 5
E) The range is 20 fish.
> The largest data is 30, smallest data is 10
Range = largest - smallest = 30-10 = 20
Ответ:
Justification of step A: common denominator
Justification of step B: multliplication property of equality
Step-by-step explanation:
i got it right.