
hannahxmurphs
01.12.2020 •
Mathematics
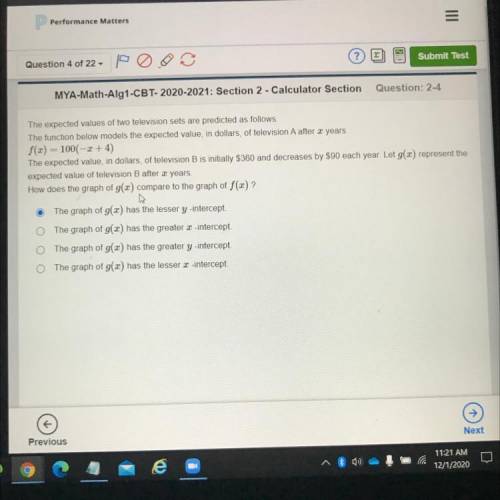
The expected values of two television sets are predicted as follows.
The function below models the expected value in dollars, of television A after 3 years.
f(x) = 100(-2+4)
The expected value, in dollars, of television B is initially $360 and decreases by $90 each year. Let g(x) represent the
expected value of television B after 3 years.
How does the graph of g(x) compare to the graph of f(x)?
The graph of g(x) has the lesser y-intercept.
The graph of g(x) has the greater 2-intercept.
The graph of g(x) has the greater y -intercept.
o The graph of g(x) has the lesser x-intercept.
Solved
Show answers
More tips
- L Leisure and Entertainment What Movies You Should Watch: A Guideline to Make the Right Decision...
- F Family and Home How to Choose a Baby Stroller: Tips from Experienced Parents...
- H Health and Medicine 5 Simple Steps to Quit Smoking for Good...
- C Computers and Internet How to Download Videos from YouTube? Simple Steps to Download Any Content...
- H Health and Medicine What is the Normal Blood Sugar Level in a Healthy Person?...
- S Style and Beauty How to Get Rid of Acne: Scientifically Proven Methods...
- L Leisure and Entertainment How to Choose the Perfect Gift for Men on February 23rd?...
- C Computers and Internet How to Delete Your Account on Odnoklassniki...
- H Health and Medicine 10 Simple and Effective Tips on How to Lose Weight in a Week...
- F Food and Cooking What s the Best Rice for Cooking Plov?...
Answers on questions: Mathematics
- M Mathematics Tamara opens and deposit $100 into a savings account earning 2.0% simple annual interest at the end of each year she adds $100 to her account how much money does Tamara having in...
- M Mathematics For brainiest:):)(:) )...
- M Mathematics HELP ASAP PLEASE NEED HELP...
- M Mathematics Help me pleaseThis is indistinguishable to another one of my posts but not the same...
- M Mathematics Need this right NOW IF YOU GET THIS RIGHT ILL GIVE BRAINLIEST...
- M Mathematics Greg went to the store. He bought 5 kilograms of purple beads, 1/2 of a kilogram of orange beads, and 2 kilograms of white beads. How much did he spend?...
- M Mathematics A convex hexagon has exterior angles with measures 34°, 49°, 58°, 67°, and 75°. What is the measure of an exterior angle at the sixth vertex?...
- M Mathematics In ΔOPQ, the measure of ∠Q=90°, the measure of ∠O=29°, and QO = 26 feet. Find the length of PQ to the nearest tenth of a foot....
- M Mathematics Walter lived 2 years longer than his brother Martin. Walter was 79 at the time of his death. Which equation could be used to find Martin s age, a, at the time of his death? O a...
- M Mathematics Which ratio is equivalent to 17:1? Ο Α. A. 17 17 0 B. 34 to 2 O C. 1 through 17 D. 1 to 1...
Ответ:
A. The graph of g (x) has the lesser y -intercept
Step-by-step explanation:
I took the test
Ответ: