
cj9508
03.02.2020 •
Mathematics
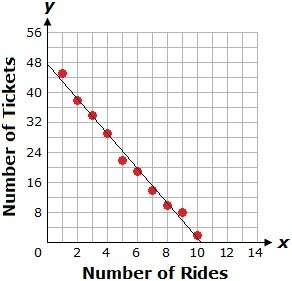
The graph below shows a line of best fit for the relationship between the number of tickets that brittany has and the number of rides she goes on at the state fair. different rides require different amounts of tickets.
the line of best fit used to model the data is shown below.
y = -4.64x + 47.6
which of the following statements is true for the above graph?
a.
the slope means that for every three tickets, brittany goes on 14 rides.
b.
the y-intercept means that brittany will run out of tickets after going on about 48 rides.
c.
the slope means that for every three rides, brittany uses about 14 tickets.
d.
the y-intercept means that brittany spent $48 on tickets.
Solved
Show answers
More tips
- H Health and Medicine How to Lower Your Child s Temperature?...
- F Food and Cooking From Latte to Espresso: Which Coffee Drink is the Most Popular on Earth?...
- C Computers and Internet How to Set Up Internet on iPhone? Detailed Guide with Step-by-Step Instructions...
- P Philosophy 8 привычек, чтобы достичь счастливой жизни...
- F Food and Cooking How Many Grams Are In a Tablespoon?...
- G Goods and services How to Choose the Right Iron: Purchase Tips...
- S Style and Beauty How to Choose the Perfect Hair Straightener?...
- H Health and Medicine How to Choose the Right Glasses?...
- H Health and Medicine What vaccines do children need?...
- H Health and Medicine AKDS Vaccination: Ensure Your Child s Safety...
Answers on questions: Mathematics
- M Mathematics Kiran s aunt is 17 years older than Kiran. x + 17 How old will Kiran s aunt be when his aunt is 60 years old? a. 32 b. 47 c. 43 d. 17...
- M Mathematics Each month, ellie spends 6 hours in tap class at her dance studio. if each month she spends 30% of her class time in tap class, what is the total number of hours she spends...
- M Mathematics Order the decimals 0.7 0.27 0.43 from least to greatest. Do the same thing with 0.4 0.22 0.72 what are your answers?...
- S Social Studies Please help I need somebody to please answer this question How is our country right now similar to the time following reconstruction. Make sure to write 2 paragraphs...
- M Mathematics The prism below is made of cubes which measure 1/3 of an inch on one side. What is the volume ?...
Ответ:
C.
The slope means that for every three rides, Brittany uses about 14 tickets.
Step-by-step explanation:
The given line of best-fit is
y = -4.64x + 47.6
Y-intercept is the point where x is zero. For the given equation y-intercept will be 47.6 or 48 rounded to nearest dollar. In other words, y-intercept is also a point where the line cross the y-axis.
From the given graph we can see that the y-axis shows the number of tickets purchased. The point where the line cross y-axis is about 48.
This tells us that Brittany had 48 tickets when she did not take any ride.
In this case, the slope of the line tells us that how many tickets were used for one ride, as x represents the number of rides. For one ride 4.64 tickets were, for 2 rides 2 x 4.64 = 9.28 tickets were used, for 3 rides 13.92 or around 14 tickets were used.
Now if we look at the given options we can easily say the option C is the correct answer.
Option A is not correct as it gives the opposite information than the actual one. Option B is also wrong, as x-intercept will tell us after how many rides the tickets will expire. Option D is wrong as y-intercept gives the number of tickets not the amount of money.
Ответ:
have to get a charger
Step-by-step explanation:
so if your smartphone dies on you u wil have to find a charger or make one and find a socket and plug it up