
bensletterbox8319
25.03.2021 •
Mathematics
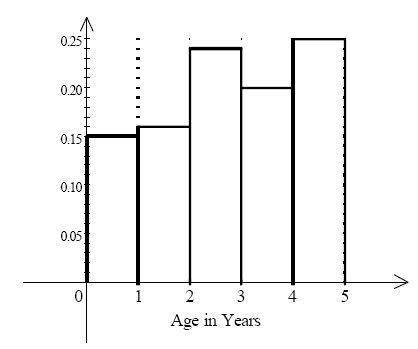
The relative frequency histogram below represents the age in years of the first 100 children to have their portraits taken at the “See What Develops” photography studio. What is the probability that the next child to have portraits taken will be between 1 and 2 years old?
Solved
Show answers
More tips
- C Computers and Internet How to Delete Your Account on Odnoklassniki...
- H Health and Medicine What to Do When Your Jaw Locks Up?...
- G Goods and services What Are the Most Popular Services?...
- P Philosophy How did the concept of module arise in computer science?...
- F Food and Cooking How to Cook Julienne? Recipes and Tips...
- D Dating, Love, Relationships 10 Useful Tips on How to Survive a Breakup?...
- F Food and Cooking Apple Cider Vinegar: The Ultimate Health and Beauty Solution...
- C Computers and Internet Е-head: How it Simplifies Life for Users?...
- F Family and Home How to Choose the Best Diapers for Your Baby?...
Answers on questions: Mathematics
- M Mathematics Clarise bought a 3 month-old kitten that weighed 4 pounds. Each month, the kitten gained 0.5 pounds when he was weighed at the vet s office. If x represents the number of months and...
- M Mathematics A hot-air balloon at 1120 feet descends at a rate of 80 feet per minute. Let y represent the height of the balloon and let x represent the number of minutes the balloon descends. (a)...
- M Mathematics William and his three friends went out for lunch. The bill was $34 and they left a 15% tip. They want to split the bill equally. How much will each person pay? *...
- M Mathematics Write the linear equations in slope-intercept form with a slope of 5 and point (2, -20)...
- M Mathematics A square has a diagonal of length 5 cm. What is the area of the square?...
- M Mathematics G morning everyone! If anyone needs help with math-related questions (unless it s Geometry), you can ask me, and I will do my best to help!...
- M Mathematics (2x-151135 Which equation can be used to find the value of x? a 2-15 = 45 2x 15 = 35 2 - 15 - 135 = 90 2x - 13 - 135 = 360...
- M Mathematics A lot of plastic straws find their way into the oceans each year.Approximately 8.3x10^9 plastic straws will find their way into the oceans in a single year.If each straw weighs 9.3x10^-4...
- M Mathematics the production cost to make 10 shirts is modeled by the expression 1.8 y +5.5 where y represents the number of meters of fabric needed to make the shirts which expression represents...
- M Mathematics I just need y intercept and equation...
Ответ: