
peno211
18.11.2020 •
Mathematics
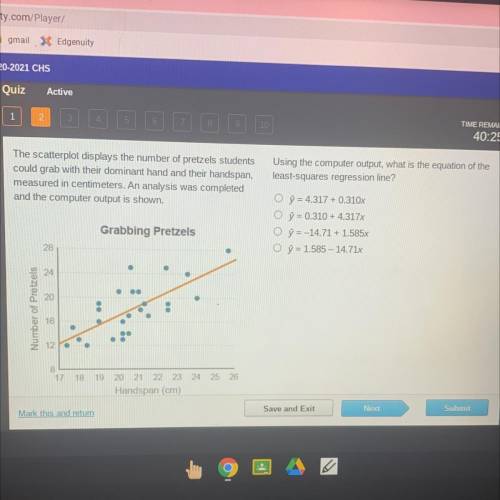
The scatterplot displays the number of pretzels students
could grab with their dominant hand and their handspan,
measured in centimeters. An analysis was completed
and the computer output is shown.
Using the computer output, what is the equation of the
least-squares regression line?
0 7 = 4.317 + 0.310x
0 $ = 0.310 + 4.317x
0 7 = 14.71 + 1.585x
O y = 1.585 - 14.71x
Grabbing Pretzels
Number of Pretzels
17 18 19 20 21 22 23 24 25 26
Handsnan (rm)
Solved
Show answers
More tips
- A Art and Culture Who Said The Less We Love a Woman, the More She Likes Us ?...
- F Family and Home How to Get Rid of Your Neighbors?...
- S Society and Politics How Could Nobody Know About the Dead Mountaineers?...
- H Health and Medicine How to Cure Adenoids?...
- H Health and Medicine Why Wearing a Back Brace Can Be Beneficial During Back Strain?...
- S Sport When and Where Will the 2014 World Cup be Held?...
- C Computers and Internet How to Choose a Monitor?...
- H Horoscopes, Magic, Divination Where Did Tarot Cards Come From?...
- S Style and Beauty How to Make Your Lips Fuller? Ideas and Tips for Beautiful Lips...
Answers on questions: Mathematics
- M Mathematics Create a system of equations where the solution is (7,-2). explain you found the system....
- M Mathematics Me solve this: 5 hundreds x 10 = hundreds=...
- M Mathematics Each week, tasha saves 65% of the money she earns babysitting and spends the rest. this week she earned $40. how much money did she save than spend this week?...
- M Mathematics Which of the following requires a proof? a. theorem b. postulate c.undefined terms d.undefined relations...
- M Mathematics 1.define phase shift. could every sine function be expressed as a phase shifted cosine function? explain....
- M Mathematics Arectangular picture frame measures 66 cm by 29 cm. what is the perimeter or distance around the picture frame in meters?...
- M Mathematics The yearbook club had a meeting. the club has 9 people, and one-third of the club showed up for the meeting. how many people went to the meeting?...
- M Mathematics What special prism has congruent squares for bases and lateral faces...
- M Mathematics Suppose that spain has a workforce of 22.85 million people, and that the average salary for each person is €24,200 annually. spain has imports of €290.85 billion and...
- M Mathematics The quotient of a number and 18 is 109.8. which statements are correct? it can be solved by using the division property of equality. it can be solved by using the multiplication...
Ответ: