
sl1010
28.09.2019 •
Mathematics
The table and graph represents two different bus to come showing the cost as a linear function of the number of people in the group. which description best compares the two functions?

Solved
Show answers
More tips
- S Sport How to Get Rid of Belly Fat: Easy Way to Achieve the Perfect Figure...
- F Family and Home When and how to start introducing solid foods to your baby?...
- B Business and Finance Moneybookers – What it is and How it Works...
- C Computers and Internet How to Format Your C Drive: Detailed Guide and Tips...
- F Food and Cooking What can and cannot be eaten during Lent?...
- H Health and Medicine What to Do When Your Jaw Locks Up?...
- F Family and Home Why Having Pets at Home is Good for Your Health...
- D Dating, Love, Relationships Is it a Compliment or Flattery: What s the Difference?...
- S Science and Technology The Metric System in Our Daily Life: Understanding Its Importance...
- C Computers and Internet What to Do If Your ICQ Gets Hacked?...
Answers on questions: Mathematics
- M Mathematics This graph shows a system of equations...
- M Mathematics Asimilarity ratio is the ratio of the lengths...
- M Mathematics Factor this expression completely 9a^4 - b^2...
- M Mathematics What side lengths form a right triangle...
- M Mathematics Hubert cut a piece of yarn into pieces that are each 2/3 foot long. if the yarn is 6 feet long, how many pieces of yarn did he cut?...
- M Mathematics There are white, blue, and red boats in a marina. three-fourths of the boats in the marina are white, 4/7 of the remaining boats are blue, and the rest are red. if...
- M Mathematics (q6) what is the domain of the function f(x)= e^x/e^x+c if c is a constant greater than 0?...
- M Mathematics The manager of the retirement plan at janet’s company told janet that if she retires now, she will earn $50,000.00 a year for the next 30 years. according to the company’s...
- M Mathematics If you added this answer what would it be? 12.35 1.80...
- M Mathematics If rstw is a rhombus, what is the area of wxt...
Ответ:
The description that best compares the two functions is:
The functions have the same initial value.
Step-by-step explanation:We are given the table for Tour 1 as:
People cost($)
1 45
2 55
3 65
4 75
The function that represents these points is given by:
y=10x+35
where x represent people and y represent the cost of x people.
This means that the rate of change is: 10
and initial value i.e. when x=0 is: 35
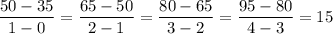
Tour 2 is given by:
People Cost ($)
0 35
1 50
2 65
3 80
4 95
Hence, we see that the initial value is: 35
and the rate of change of the function is: 15
(
Since,
 )
)
Hence, we see that the rate of change for Tour 2 is greater than Tour 1.Ответ:
44
Step-by-step explanation:
got it right on edg.