
andrespeerman
03.02.2020 •
Mathematics
Use the parabola tool to graph the quadratic function y=−2x2+12x−14 . graph the parabola by first plotting its vertex and then plotting a second point on the parabola.
Solved
Show answers
More tips
- F Family and Home How to Choose the Perfect Air Conditioner for Your Life...
- H Health and Medicine Discover the Hidden Principles and Real Results of the Japanese Diet...
- H Health and Medicine Understanding Pregnancy Tests: What You Need to Know?...
- H Health and Medicine What Makes a Man a Man?...
- C Computers and Internet How to Get Rid of Spam in ICQ?...
- A Art and Culture Who Said The Less We Love a Woman, the More She Likes Us ?...
- F Family and Home How to Get Rid of Your Neighbors?...
- S Society and Politics How Could Nobody Know About the Dead Mountaineers?...
- H Health and Medicine How to Cure Adenoids?...
- H Health and Medicine Why Wearing a Back Brace Can Be Beneficial During Back Strain?...
Answers on questions: Mathematics
- M Mathematics Products x, y, and z are produced from the same process at a cost of $6,100. five thousand pounds of raw material yields 1,950 x, 2,950 y, and 1,450 z. selling prices are: x...
- M Mathematics Use the vertical line test to determine if the graph represents a function. explain....
- M Mathematics Which set of statements explain how to plot a point at the location (-2.5,3.75)?...
- B Biology The biosphere is best described as the regions of earth that support a.plant lifeb.animal lifec.all lifed.human lifecan someone me with this one?...
- B Business In the long run, profits in a monopolistically competitive market are zero because: a. of government regulations. b. of collusion. c. firms are free to enter and exit the market....
- A Arts Which of the following is the pitch names located in the F-clef staff space? E-G-B-DF-A-C-EG-B-D-FA-C-E-Gi need this right now im on a exam...
Ответ:
Check attached graph
Step-by-step explanation:
Given equation of the parabola is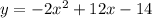 .
.
Nowe we need to use the parabola tool to graph the quadratic function. Graph the parabola by first plotting its vertex and then plotting a second point on the parabola.
Compare Given equation with we get: a=-2 and b=12
then x-coordinate of vertex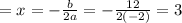
plug x=3 into given function
Hence vertex is (3,4).
Plug any x-value say x=0 into given function to find other point
Hence second point is (2,2)
now graph the parabola using both points as shown below:
Ответ: