
XxLydiaxXwolf773
22.09.2019 •
Mathematics
Which graph best represents the solution to the following pair of equations?
y = −2x + 13
y = 2x − 3
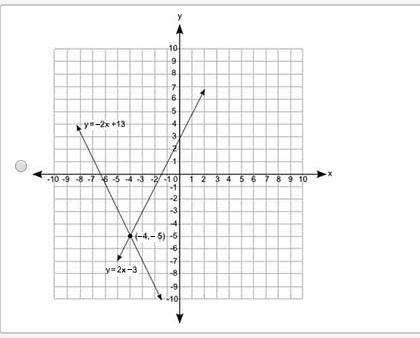
a graph is plotted with values ranging from negative 10 to 10 on both x axis and y axis at increments of 1. two lines having equations y is equal to negative 2 times x plus 13 and y is equal to 2 times x minus 3 are plotted. these 2 lines intersect at the ordered pair negative 4, negative 5.
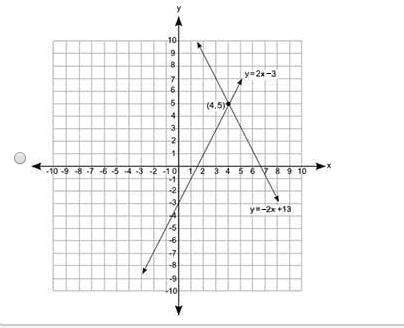
a graph is plotted with values ranging from negative 10 to 10 on both x axis and y axis at increments of 1. two lines having equations y is equal to negative 2 times x plus 13 and y is equal to 2 times x minus 3 are plotted. these 2 lines intersect at the ordered pair 4, 5.
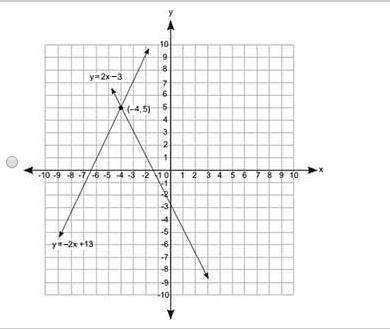
a graph is plotted with values ranging from negative 10 to 10 on both x axis and y axis at increments of 1. two lines having equations y is equal to negative 2 times x plus 13 and y is equal to 2 times x minus 3 are plotted. these 2 lines intersect at the ordered pair negative 4, 5.
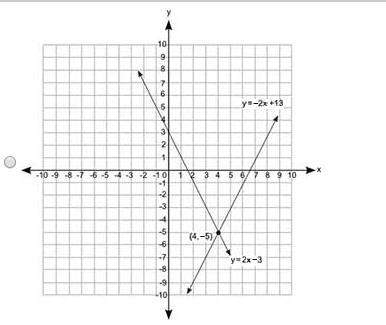
a graph is plotted with values ranging from negative 10 to 10 on both x axis and y axis at increments of 1. two lines having equations y is equal to negative 2x plus 13 and y is equal to 2x minus 3 are plotted. these 2 lines intersect at the ordered pair 4, negative 5.
Solved
Show answers
More tips
- L Leisure and Entertainment How Many Seasons are There in the TV Show Interns?...
- S Sport When will the Biathlon World Championships 2011 take place in Khanty-Mansiysk? Answers to frequently asked questions...
- H Health and Medicine Trading Semen for Money: Where Can You Sell and Why Would You Want to?...
- F Food and Cooking Homemade French Fries: The Ultimate Guide...
- H Health and Medicine How to Increase Blood Pressure without Medication?...
- S Style and Beauty Choosing a Hair Straightener: Specific Criteria to Consider...
- F Food and Cooking How to Make Polendwitsa at Home?...
- S Science and Technology When do we change our clocks?...
- L Leisure and Entertainment What to Give a Girl on March 8?...
- F Family and Home Is it Worth Knowing the Gender of Your Child Before Birth?...
Answers on questions: Mathematics
- M Mathematics Ayo just failed my math test chec...
- M Mathematics PLEASE HELPPPP WILL CHOOSE BRAINLIEST!! (plz answer all of them. plz.)...
- M Mathematics Figure DEFG is dilated using a scale factor of} with a center of dilation at vertex Eto form figure D E F G . Then the image is reflected across the x-axis to form figure D...
- M Mathematics Please help !! write an expression that can be used to determine the total cost....
- M Mathematics Please help me with this question...
- M Mathematics WILL LIST BRAINLIEST AND LOTS OF POINTS!! We just finished talking about parent function and transformations. What are the four different types of transformations? How many...
- M Mathematics What is the result of 5 divided by 1/5? O. 1/25 O. 1/5 O. 1 O. 25 Just joined and getting comfortable with the app! ❤️ 25 PT...
- M Mathematics 9. Which of the following relations are functions? Choose all that apply. Assume that each different variable (2 points) has a different value. 0{(2,6).(8.a),(6.0). (,d)) {(c,e),(c,d).(0,5)}...
- M Mathematics Kdkdkdkkdjdkekekw PLEASE HELP ME...
- M Mathematics HHHHHHEEEEEEEEELLLLLLLLLPPPPPP...
Ответ:
ANSWER
See attachment
EXPLANATION
The given equations are:
y = −2x + 13
y = 2x − 3
We equate the two equations to get
−2x + 13=2x − 3
Group similar terms:
-2x-2x=-3-13
-4x=-16
Divide both sides by -4,
x=4
Put x=4 into equation (2)
y=2(4)-3
y=5
The two graphs should intersect at:
(4,5)
Ответ:
3/20
Step-by-step explanation: