
micahwilkerson9495
28.01.2020 •
Mathematics
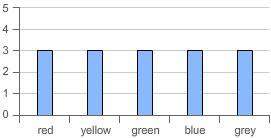
Which probability distribution table reflects the data shown in the bar graph?
(graph at the bottom)
x p
red 0.3
yellow 0.3
green 0.3
blue 0.3
grey 0.3
x p
red 0.1
yellow 0.2
green 0.3
blue 0.4
grey 0.5
x p
red 0.2
yellow 0.2
green 0.2
blue 0.2
grey 0.2
x p
red 0.5
yellow 0.4
green 0.3
blue 0.2
grey 0.1
Solved
Show answers
More tips
- C Computers and Internet How to Download Movies from Torrents?...
- F Food and Cooking How to Make the Perfect Glühwein: Step-by-Step Guide...
- A Animals and plants How to Grow Lime from a Seed: Simple Tips and Interesting Facts...
- S Style and Beauty How to Properly Tie a Tie: 5 Simple Steps...
- C Computers and Internet Dynamically Assigned IP Address: What Is It and How Does It Work?...
- C Computers and Internet How to Check the Speed of My Internet?...
- H Health and Medicine 5 Simple Steps to Quit Smoking for Good...
- C Computers and Internet How to Download Videos from YouTube? Simple Steps to Download Any Content...
- H Health and Medicine What is the Normal Blood Sugar Level in a Healthy Person?...
- S Style and Beauty How to Get Rid of Acne: Scientifically Proven Methods...
Answers on questions: Mathematics
- M Mathematics What is the solution to this inequality -6( p - 8) -12 answer choices p 10 p 2/3 p 6 p -2...
- M Mathematics The value of y varies directly with x, and y = 12 when x = 16. find y when x = 6. a. 8 b.12 c.2/9 d.9/2...
- M Mathematics Tomas wrote the equation y=3xt3/4 when sandra wrote her equation they discovered that her equation had all the same solutions as tomas equation which equation could be...
- M Mathematics Suppose 3x + 4y = 52 and 5x + y = 30. what is the value of 8x − 2y?...
- M Mathematics What is the domain of this function? -1 2 3 6 5 8 a. {3} b. {2,6,8} c. {2,6,8,3,5} d. {-1,3,5}...
- M Mathematics If the federal reserve decreases the reserve rate from 5% to 2.5%, how does this affect the amount of money that would result because of fractional-reserve banking from...
- M Mathematics If 5x2 + 7x = 6, which statement is correct? a) x = 2 or x = 3/5 b) x = –2 or x = 3/5 c) x = 2 or x = –3/5 d) x = –2 or x = -3/5...
- M Mathematics Alicia is making a triangular sign for the school play. the area of the sign is 558 in. the base of the triangle is 36in. what is the height of the triangle?...
- M Mathematics Identify a counterexample for the following conditional: if you live in springfield, then you iive in illinois....
- M Mathematics Asign in front of a roller coaster says you must be 40 inches tall to ride what percentage of the height is 34 inches p.s also do 54 inches....
Ответ:
its the 3rd one
Step-by-step explanation:
Ответ:
Step-by-step explanation:
A probability distribution is one which gives various values of a random variable X along with assigned probabilities
The conditions for probabilities is each probability should be positive andlying between 0 and 1. Also total of the probabilities should equal 1.
COmparing this with the given tables we find that I one total probability
=1.5 hence cannot be a prob distribution
Second distribution has unequal probabilities between 0 and 1 but total is 1.4 hence cannot be a prob distn.
III one has all probabilities equal to 0.2 a value between 0 and 1 and total prob =1 This tallies with the graph with equal probabilities. Hence option III is the right answer
we find that table 4 total probability
=1.5 hence cannot be a prob distribution
So answer is option 3
Ответ:
Answer is in the steps
Step-by-step explanation:
The perfect square that is less than 15 is 9 and greater 15 is 16 and the square root of 15 falls between 3 and 4 because 3 times 3 is 9 and 4 times 4 is 16.
First row: 9 < 15 < 16
Second row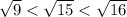
Third row ; 3 < < 4
< 4