
briannabo08
04.04.2020 •
Mathematics
WILL MARK BRAINLIEST
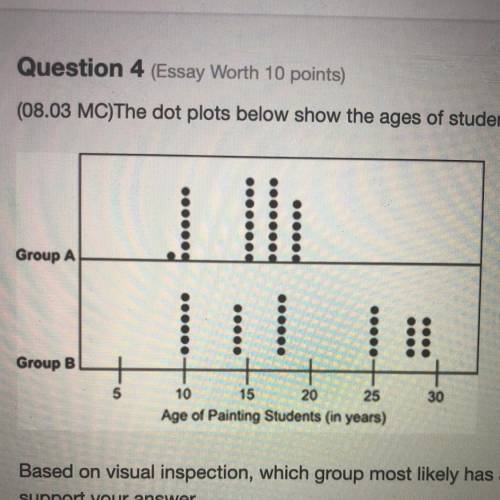
The dot plots below show the ages of students belonging to two groups of painting classes:
Group A
Group B
10 15 20 25
Age of Painting Students in years)
30
Based on visual inspection, which group most likely has a lower mean age of painting students? Explain your answer using two or three sentences. Make sure to use facts to
support your answer.
Solved
Show answers
More tips
- C Cities and Countries Which Country has the Most Expensive Visa?...
- F Family and Home Tender Care for Your Parquet: Is it Possible to Clean Parquet?...
- S Society and Politics Is It Fact or Fiction? Let s Talk About Anton Chekhov s Pseudonym...
- S Sport Playing Bowling: Rules and Advice for Novices...
- C Computers and Internet How to Properly Repartition a Hard Drive?...
- A Auto and Moto What Is the Cost of Customs Clearance for a Car in Russia?...
- L Leisure and Entertainment Should You Buy a Ceramic Knife?...
- C Computers and Internet How to easily and quickly disable Firebug in Gmail and Google Docs...
- G Goods and services How to sew a ribbon: Tips for beginners...
- F Food and Cooking How to Make Mayonnaise at Home? Secrets of Homemade Mayonnaise...
Answers on questions: Mathematics
- M Mathematics What value for x will balance the hanger? 7 10 х...
- M Mathematics Each car can hold 5 students and each minibus can hold 15 students. There will be 85 students on the trip. Let x be the number of cars and y the number of minibuses...
- M Mathematics A 50% DISCOUNT IF THE SWAETSHIRT COST $64.75, HOW MUCH DID ADAM PAY ROUNDED TO THE NEASRT HUNDERTHS...
- M Mathematics Any genius out there to solve this? which is the missing number in the sequence below? 5,6,9,15,?,40...
- G Geography Ok guys whats the answer SMASH OR PASS (I KNOW UR ANSWER DONT WORRY U CAN HURT MY FEELINGS LMA0)...
- M Mathematics Aplane intersects a pris paralel to the base of the prism. the cross section is a polygon wth eight sides. how many sides does the base of the prism have? a. 10...
Ответ:
Group A.
Step-by-step explanation:
As shown by the dot plots, Group A has one 9-year-old painter, seven 10-year-old painters, and 24 painters between the ages of 15 and 20. Group B has seventeen painters between the ages of 10 and 20 and thirteen painters between the ages of 25 and 30. Since mean is the average of everything, Group A most likely has a lower mean age of painting students than Group B does.
Ответ:
Dont post stuff like this. Im doing it as an answer so you'll see it.