
There can be more then one
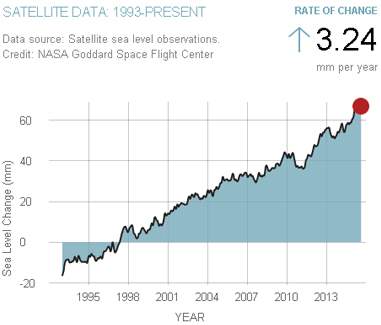
the chart shows changes in sea level from 1995 to 2013. according to the chart, sea levels rose at an average annual rate of 3.24 millimeters from 1995 to 2013. which questions can be asked to check whether global warming is the cause of rising sea levels?
did the global surface temperature increase steadily from 1995 to 2013?
did sea ice extent in polar regions reduce because of melting from 1995 to 2013?
how will the change in sea level affect marine economic activities such as fishing?
will the rise in sea levels cause soil in coastal areas to become less fertile?
which islands are under threat of flooding from rising sea levels?
Solved
Show answers
More tips
- F Food and Cooking How to salt lard?...
- W Work and Career Can Skill Alone Make You a Professional?...
- C Computers and Internet How to Top Up Your Skype Account Without Losing Money?...
- P Philosophy Unidentified Flying Object - What is the Nature of this Phenomenon?...
- F Family and Home Protect Your Home or Apartment from Pesky Ants...
- O Other What is a Disk Emulsifier and How Does it Work?...
- F Family and Home What does a newborn need?...
- F Family and Home Choosing the Right Car Seat for Your Child: Tips and Recommendations...
- F Food and Cooking How to Get Reconfirmation of Registration?...
Answers on questions: Biology
- B Biology Use the density equation to solve the problems. equation: density = mass or d = m volume v a block of wood has a density of 0.6 g/cm3 and a volume of 1.2 cm3. what is the mass...
- B Biology What are the types of molecules and the number needed to form a fat molecule?...
- B Biology How many times a year are you able to see a full moon?...
- B Biology During the electron transport chain which process leads to the production of large amounts of atp...
- B Biology To see patterns in the data from an experiment like this, it is to graph the data. a bar graph is used instead of a line graph because each type of liver cell was independent...
- B Biology The nonmutant allele of the brca1 gene to suppress tumor formation in women who are heterozygous for the mutation. women heterozygous for brca1 nevertheless have a 50% to 70%...
- B Biology To maintain the accuracy of the genome sequence, the dna should not be cut into small pieces before sequencing.a) true b) false...
- B Biology The neurotransmitter acetylcholine, released by a neuron at a neuromuscular junction binds to nicotinic acetylcholine receptors on the cell membrane of the skeletal muscle cell...
- B Biology Genes a, b, and c are located on the same chromosome. testcrosses show that the recombination frequency between a and b is 28% and that between a and c is 12%. can you determine...
- B Biology Which of the following pairs work together to form the neuroendocrine system? o a. amino acids and neurons o b. hormones and proteins o c. neurons and nerve impulses o d. neurotransmitters...
Ответ:
Did sea ice extent in polar regions reduce because of melting from 1995 to 2013?
Which islands are under threat of flooding from rising sea levels?
These generally is more scientific than economical, like this one:
How will the change in sea level affect marine economic activities such as fishing?
hope this helps
Ответ:
Hope this helps