
mdlemuslopez
27.09.2021 •
Mathematics
6.3.4 Journal: Graphs of Exponential Functions
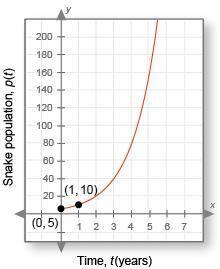
Below is the graph of the boa constrictor population you learned about in the video. The x-axis is t, the time in years, and the y-axis is p(t), the snake population for any given year. In this case, t = 0 indicates the year they started keeping track of the constrictor population. Scientists want to know how the population is changing every two years so they can make predictions about the future.
Analyzing the Data:
1. Is this graph increasing or decreasing? Does this imply that the boa constrictor population is growing or diminishing? (1 point)
2. Looking at this graph, would you agree that the boa constrictor population could become a problem? (1 point)
3. What is the horizontal asymptote of this graph? (1 point)
4. What is the domain? Explain. (1 point)
5. What is the range? Explain. (1 point)
6. What is the y-intercept? What does this mean in terms of the snake population? (1 point)
7. What is the point on the graph when x = 1? What does this mean in terms of the snake population? (1 point)
8. The graph is of a function in the form p(t) = a • bt. What is the function? (2 points)
9. Use this function to estimate the boa constrictor population in 2 years, 3 years, and 4 years. (6 points: 2 points for each year, including 1 point for showing your work and 1 point for the answer)
10. What pattern do you see in years 2, 3, and 4? How is the snake population changing every year? (2 points)
11. How is the snake population changing every two years? (1 point)
Making a Decision:
12. Do you think the snake population can continue to grow in this way forever? Why or why not? (2 points)
Solved
Show answers
More tips
- F Food and Cooking Pu-erh Tea: History, Varieties, Benefits, and Risks...
- H Health and Medicine How to Whiten Teeth and Get the Perfect Smile...
- F Food and Cooking How to Make Thin Pancakes: Recipe and Tips...
- S Style and Beauty Is Hot Scissor Haircutting Beneficial or Dangerous?...
- S Style and Beauty How to Get Rid of Under Eye Bruises?...
- F Food and Cooking Is Bacon Good for You?...
- S Style and Beauty Discover the Art of Nail Design: How Do You Paint Your Nails?...
- P Philosophy How to Develop Extrasensory Abilities?...
- O Other Everything You Need to Know About Kudyabliks...
- C Computers and Internet The Twitter Phenomenon: What it is and How to Use it...
Answers on questions: Mathematics
- M Mathematics Find the number of possible choices for a 3-digit pin (personal identification number) if the digits can be repeated....
- M Mathematics Solve tina starts with $.10 and put it in her piggy bank in january then she doubles it in february to put in $.20 if she keeps doubling the amount she puts in her bank...
- M Mathematics Compare your answers in step 1 and with the equation of the graphed line....
- M Mathematics What is the y-intercept of 10/-5...
- M Mathematics Lauren graphed the relationship between how many days had passed since she planted a cactus and it’s height (in centimeters)...
- M Mathematics A(b) = 41 + b how much does alan earn in a week if he sells 24 books?...
- M Mathematics Intersection point of y=logx and y=1/2log(x+1)...
- M Mathematics Er at the correct since 2 is further left on a number line than 5, 2 5. let s consider the opposites of these numbers. identify the opposite of 2 on the number line. 3...
- M Mathematics Which expression represents the approximate length of line segment b c? use sines law...
- M Mathematics Question 7 which equation represents a linear function? x = 3 y = -3x + 10 y = 3x2 + 1 y=16/x...
Ответ:
(0,7/2) (1, 17/4) (2,5)
three ordered pair soultions
Step-by-step explanation: