
matthewboeckman6831
21.10.2020 •
Mathematics
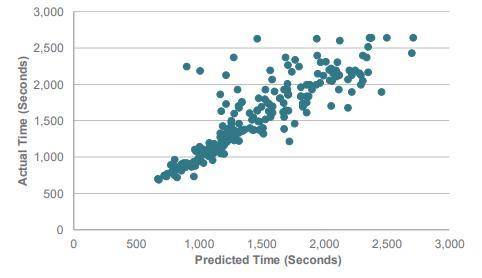
AP Statistics teachers from across the country meet annually in Kansas City to score AP Statistics
exams. One social event that many teachers participate in is the annual Prediction Fun Run. Prior to the
race, the teachers predict how long it will take them to complete the 1.96-mile long course. During the
event, they are timed and their actual finishing times are paired with their predicted times. Here is a
scatterplot of the results.
The winner of the race is not the fastest runner, but the most accurate runner.
a) Let x = the runner’s predicted time (in seconds) and y = the runner’s actual time (in seconds).
Provide the equation of the line that can be used to assess how accurate the runners were. Plot
this line on the graph above. Clearly label two points you are using to plot the line.
b) Is the line you drew in part (a) a least-squares regression line for these data? Explain.
c) While many runners were quite good at predicting their race time, some runners did very poorly at
this task. Circle the point of the runner who had the largest error in prediction. Justify your choice.
Was this runner faster or slower than predicted?
d) Describe the relationship between predicted time and actual time. Are all runners able to predict
their actual times approximately equally well?
Solved
Show answers
More tips
- F Food and Cooking How to Find Your Zip Code?...
- W Work and Career Can Skill Alone Make You a Professional?...
- C Computers and Internet How to Top Up Your Skype Account Without Losing Money?...
- P Philosophy Unidentified Flying Object - What is the Nature of this Phenomenon?...
- F Family and Home Protect Your Home or Apartment from Pesky Ants...
- O Other What is a Disk Emulsifier and How Does it Work?...
- F Family and Home What does a newborn need?...
- F Family and Home Choosing the Right Car Seat for Your Child: Tips and Recommendations...
- F Food and Cooking How to Get Reconfirmation of Registration?...
Answers on questions: Mathematics
- M Mathematics . If the mass of an object on Earth is 18kg what would the mass of the same object be on the Moon? A. 18kg B. 6kg C. 108kg D. 3kg...
- M Mathematics Sean and Colleen are raking leaves in their yard. Working together, they can clear the yard of leaves in 24 minutes. Working alone, it would take Sean 20 minutes longer...
- M Mathematics Q5. Here are two statements about the math in Q1 to Q4 above. For each question, decide which statements are true. Explain your answers. If you double one quantity, you...
- M Mathematics You can use the notation (1, 10) → (1, 4) to show how a point is transformed. When you use this notation to show how a general point (x, y) is transformed, you are expressing...
- M Mathematics Juan dispone de $ 500.000 y tiene las siguientes alternativas para invertir su dinero durante un año, estas son: Depósito en el Banco Nacional a una tasa de interés de...
- M Mathematics Rectangle FGHJ has coordinates F(-8, 6), G(8, 6), H(8,-6), and J(-8, -6). The rectangle is dilated by a scale factor of v with the origin as the center of dilation to form...
- M Mathematics Leah would like to earn at least $120 per month. She babysits for $5 an hour and works at an ice cream shop for $10 per hour. Let x represent the hours she number of hours...
- M Mathematics Megan cut a string into 4 equal pieces. Each piece is 4 fifths of a foot long. How many feet long was the string before Megan cut it? Enter your answer as a mixed number...
- M Mathematics Judy is baking 5 cheesecakes. A recipe for one of the cheesecakes requires 1 1 2teaspoons of vanilla. Judy s bottle of vanilla contains 12 teaspoons of vanilla. After Judy...
- M Mathematics Solve the equation for y. yk+yv=r y=?...
Ответ:
Option D: is the resulting expression.
Explanation:
The given expression is
We need to determine the factors of the expression by grouping.
Let us group the expression.
Thus, we have,
Now, we shall factor out the common terms from both the terms.
Thus, we have,
Let us factoring out the common term (4x+1), we get,
Hence, the resulting expression is
Therefore, Option D is the correct answer.