
reycaden
07.01.2021 •
Mathematics
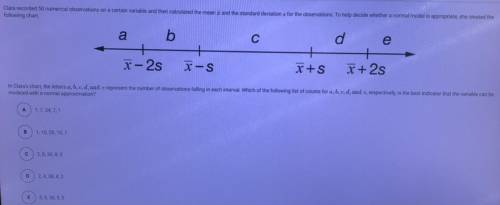
Clara recorded 50 numerical observations on a certain variable and then calculated the mean and the standard deviations for the observations. To help decide whether a normal model is appropriate, she created the
following chart
a
b
с
d
e
X-2s
X-S
X+S
X + 2s
In Clara's chart, the letters a, b, c, d, and c represent the number of observations falling in each interval. Which of the following list of counts for a, b, c, d, and e, respectively, is the best indicator that the variable can be
modeled with a normal approximation?
А
1.7,34,7,1
1,10,28, 10,1
С
2,8, 30, 8,2
D
2, 4, 38, 4,2
E
5,5, 30,5,5
Solved
Show answers
More tips
- O Other What is the oldest joke ever told?...
- F Food and Cooking How to Make Lazy Cabbage Rolls? Simple Steps to a Delicious Dish...
- F Food and Cooking Unusually Delicious Shashlik - Follow the Etiquette of Proper Preparation!...
- L Leisure and Entertainment Couchsurfing: A New Way to Travel...
- G Goods and services Which TV is better - LCD or Plasma?...
- S Sport How to Learn to Pull Up on Monkey Bars?...
- L Leisure and Entertainment Scrapbooking: What is it and Why is it Becoming More Popular?...
- C Computers and Internet Where did torrents.ru move to?...
- B Business and Finance Understanding Cash Flow: What It Is and How It Works...
- C Computers and Internet What Are Peers and Seeds in Torrenting?...
Answers on questions: Mathematics
- M Mathematics Please help and if you can’t see it zoom in :)...
- M Mathematics Problem: A circuit is supplied by a 220,000 mv to a 30 ohms bulb, find the current capacity of the circuit. please help me in my mathneed complete solution thanks...
- M Mathematics A truck can be rented from company A for $100 a day plus $0.60 per mile. Company B charges $40 a day plus $0.90 per mile to rent the same truck. How many miles...
- M Mathematics a small business woman has realised that one of her products,if the price per unit is ghc 20 she can sell 300 units a day. On the other hand,if thr price per unit...
- M Mathematics A large orange weighs 11/16 pound. A small orange weighs 2/8 pound. How much more does the large orange weigh?...
- M Mathematics Graph the equation uninformed the point and the slope. Y-4=1/3(x-2) This is point-slope form. Thank you...
- M Mathematics Tìm a,b sao cho a78b chia hết cho 2,3,5,9...
- M Mathematics For my Homework tomorrow...
- M Mathematics Please please help me with this question please help me now please...
- M Mathematics Select all of the expressions that have the same value ad 925÷6...
Ответ:
It would be 63 diagonally between corners of the pool.