
Jasten
21.05.2021 •
Mathematics
Goal: To use the line of best fit to make predictions
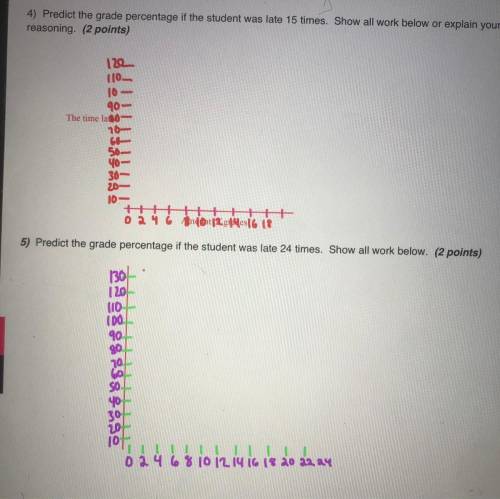
The chart below shows the number of times a student was late for Math Class as well as student's grade
in the class. Plot the points on the coordinate plan and answer questions a- e.
Number of
Late Arrivals
12
4
0
10
15
18
00
1
3
00
0
7
10
2
11
Grade (%)
65
75
78
45
58
54
68
85
90
63
82
72
62
76
71
Hi
Solved
Show answers
More tips
- L Leisure and Entertainment How to Identify a Song? Which Program Can Recognize a Song by Its Melody?...
- H Health and Medicine Boosting Immunity: A Complete Guide on How to Improve Your Body’s Natural Defenses...
- C Computers and Internet The Best Antivirus Programs for your PC...
- S Style and Beauty How to Get Rid of Acne: Scientifically Proven Methods...
- H Health and Medicine Simple Ways to Lower Cholesterol in the Blood: Tips and Tricks...
- O Other How to Choose the Best Answer to Your Question on The Grand Question ?...
- L Leisure and Entertainment History of International Women s Day: When Did the Celebration of March 8th Begin?...
- S Style and Beauty Intimate Haircut: The Reasons, Popularity, and Risks...
- A Art and Culture When Will Eurovision 2011 Take Place?...
- S Style and Beauty How to Choose the Perfect Hair Straightener?...
Answers on questions: Mathematics
- M Mathematics Determine the intercept of the line that passes through the following points....
- M Mathematics Afarmer has a bale of hay with a mass of 36 kg. how many milligrams of hay are in the bale?...
- M Mathematics The length of albert s rectangular are listed below. length- 40 feet width- 20 feet the perimeter of tony s rectangular backyard is 2.5 times the perimeter of albert s backyard....
- M Mathematics Round 16,311 to the nearest thousand...
- M Mathematics Solve 3/5x ≤ 10. graph the solution...
- M Mathematics And explain how you got the answer. so much!...
- M Mathematics Choose the correct answer. clarence avenue runs into wilson road at a 90 degree angle; the two streets are to each other. a) parallel b) variable c) perpendicular d) equation...
- M Mathematics Write a problem that has two parts. then solve it by finding the whole...
- M Mathematics The table shows ava s checking account activity for several weeks. ava s beginning balance was $685. what was her ending balance? three column table titled avas account. data in...
- M Mathematics How many solutions does the system of linear equations have ? y=3/4x+12...
Ответ:
get help from your teacher
Step-by-step explanation: