
solisemily62
01.02.2021 •
Mathematics
PLEASE HELP
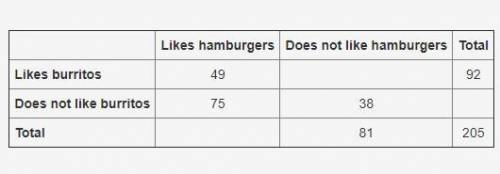
A food truck did a daily survey of customers to find their food preferences. The data is partially entered in the frequency table. Complete the table to analyze the data and answer the questions:
Likes hamburgers Does not like hamburgers Total
Likes burritos 49 92
Does not like burritos 75 38
Total 81 205
Part A: What percentage of the survey respondents do not like both hamburgers and burritos? (2 points)
Part B: What is the marginal relative frequency of all customers that like hamburgers? (3 points)
Part C: Use the conditional relative frequencies to determine which data point has strongest association of its two factors. Use complete sentences to explain your answer. (5 points)
Solved
Show answers
More tips
- C Computers and Internet Boost your processor performance with these easy tips...
- L Leisure and Entertainment When will Maslenitsa start?...
- F Food and Cooking Discovering the Mysterious Fruit of Feijoa...
- B Business and Finance How to Open an Online Store? A Detailed Guide for Beginners...
- W Work and Career How to Write a Resume That Catches the Employer s Attention?...
- C Computers and Internet Е-head: How it Simplifies Life for Users?...
- F Family and Home How to Choose the Best Diapers for Your Baby?...
- F Family and Home Parquet or laminate, which is better?...
- L Leisure and Entertainment How to Properly Wind Fishing Line onto a Reel?...
- L Leisure and Entertainment How to Make a Paper Boat in Simple Steps...
Answers on questions: Mathematics
- M Mathematics Sequences 3, 7, 11, 15, , 4, 8, 16, 32, , 9, 16, 25, 36, , 256, 64, 16, 4, , 50, 45, 34, 26, ,...
- M Mathematics Find m∠BXY. HELPPPPP PLS...
- M Mathematics For exercises 7-9 write expressions for the area of each rectangle in two different ways. Then find the area using each expressions....
- M Mathematics How many atoms are in 3.40 moles of sugar Please explain how you got the answer and show the work with using Avogardos Number...
- M Mathematics HELP I HAVE A TEST TMR MORNING A boat tied up at a dock bobs up and down with passing waves. The vertical distance between its high point and its low point is 1.8m and...
- M Mathematics 1. Beth is buying 3 pounds of chicken thighs for $1.29 per pound. How much will she pay? How many servings will the thighs provide?...
- M Mathematics 10 points 9. Chloe started the school year with $75 in her school lunch account. Each day she buys the Frutti Tutti special for $3.00. Kenzi started the year with $90...
- M Mathematics What is the total weight of the steel gate...
- M Mathematics Can someone explain what I m doing wrong? (related rates)...
- M Mathematics 10 pts in golf, each hole is assigned a number of strokes it should take to get the ball in the hole. this is called par.” which scenario best describes the number line...
Ответ:
Then she writes a check wich is negative so you do $148.48 - $156.61
I belive it's -$8.23.
hope it helps.