
andreamarie2004amg
21.09.2019 •
Mathematics
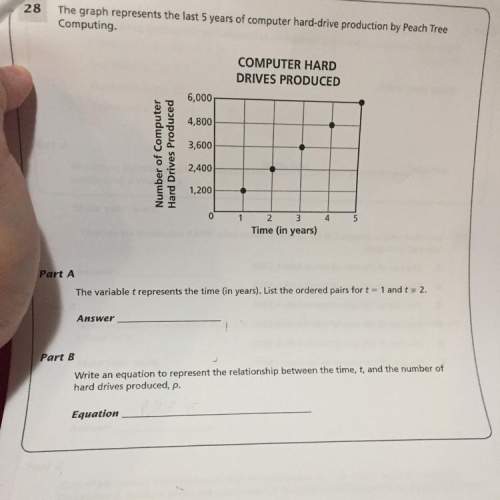
The graph represents the last 5 years of computer hard-drive production by peach tree computing
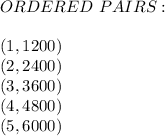
part a: the variable t represents the time (in years).list the ordered pairs for t=1 and t=2.
part b: write an equation to represent the relationship between the time,t, and the number of hard drives produced,p.
Solved
Show answers
More tips
- H Health and Medicine How to Treat Styes: Causes, Symptoms, and Home Remedies...
- C Computers and Internet How to Learn to Type Fast?...
- F Food and Cooking Delight for Gourmets: How to Prepare Liver Pate...
- S Style and Beauty How to braid friendship bracelets?...
- H Health and Medicine Mercury Thermometer Danger: What to do when a thermometer breaks?...
- F Food and Cooking Which Calamari Salad is the Most Delicious?...
- S Society and Politics 10 Tips for Boosting Your Self-Esteem...
- F Food and Cooking The Most Delicious and Simple Fish in Batter Recipe...
- H Health and Medicine What is Autism? Understanding the Basics of This Neurodevelopmental Disorder...
- P Philosophy How to Develop Extrasensory Abilities?...
Answers on questions: Mathematics
- M Mathematics Plz I´m lost all my brain cells I need a refresh button somebody please help!!...
- M Mathematics ILL MAKE BRAINLEST YOUR GONNA HAVE TO ZOOM IN BUT AM I RIGHT...
- M Mathematics Cora drew 2 regular triagles. each side of the first triamgle was 9 centimeters long. each side of the second triangle was 21 centimetrs long. in centimeters what was the difference...
- M Mathematics How much money did he spend?...
- M Mathematics EMERGENCY! PLEASE ANSWER ASAP!...
Ответ:
In this problem, we have a graph that represents the last 5 years of computer hard-drive production by Peach Tree Computing. The variable represents the time (in years), so we need to list the ordered pairs for
  . An ordered pair are two numbers written in a certain order usually in parentheses like
  . Here in this problem
  will represent the time
  while
while  will represent the Number of Computer Hard Drive Produced
  , thus:
PART B)Here we need to write an equation to represent the relationship between the time and the number of hard drive produced
  . The points construct a linear equation, so:
Then:
Ответ:
(3,-1) is a solution but (4,3) is not a solution
Step-by-step explanation:
You simply look to see if x in both ordered pairs are 3 since you are given the equation x=3 then x needs to equal 3 for it to be valid