
joshuag5365
05.05.2020 •
Mathematics
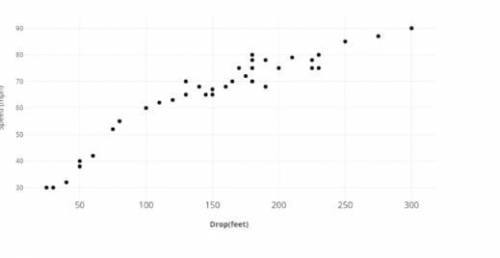
The scatter plot below shows the relationship between drop height and speed of a roller
coaster
i
Roller Coasters
The linear equation that best models this data is y=0.216x + 32.575
What is the y-intercept and what is the slope here is a picture of the graph
Solved
Show answers
More tips
- A Auto and Moto How to choose the right drive for your BMW...
- L Leisure and Entertainment How to Choose the Perfect Gift for Men on February 23rd?...
- H Health and Medicine How to Treat Whooping Cough in Children?...
- H Health and Medicine Simple Ways to Lower Cholesterol in the Blood: Tips and Tricks...
- O Other How to Choose the Best Answer to Your Question on The Grand Question ?...
- L Leisure and Entertainment History of International Women s Day: When Did the Celebration of March 8th Begin?...
- S Style and Beauty Intimate Haircut: The Reasons, Popularity, and Risks...
- A Art and Culture When Will Eurovision 2011 Take Place?...
- S Style and Beauty How to Choose the Perfect Hair Straightener?...
- F Family and Home Why Having Pets at Home is Good for Your Health...
Answers on questions: Mathematics
- M Mathematics haley puts these 12 tiles in a bag and shakes the bag.Then she picks a tile at random.What is the probability she picks a tile that is multiple of 3...
- M Mathematics Fall guys: you took everything from me... among us: nah bro i was doing tasks in electrical....
- M Mathematics Geometry solve with sine...
- M Mathematics Two Heads 22 Two Tails 24 One head, One Tail 54 PLEASE HELP WORTH 40 POINTS!! 1. What is the theoretical probability that a coin toss results in two heads showing? 2....
- M Mathematics How is this happening i was only gone for 2 weeks...
- M Mathematics Simplest form of a3b3c a-3b-3c-1...
- M Mathematics grocery shopping twenty percent of consumers prefer to purchase groceries online. You randomly select 16 consumers...
- M Mathematics 2. A drinking glass is shaped like a cylinder, as shown below. -8 cm 116 cm Which measurement is closest to the volume of the drinking glass in cubic centimeters?...
- M Mathematics Instructions: y varies indirectly with x. If y=7 when x = -4, find y when x = 2. Use the forward slash (i.e. / ) for all fractions (e.g. - 1/2 is the same as --). Equation:...
- M Mathematics Find the area of the rhombus...
Ответ:
Using the equation of best fit provided:
y=0.216x + 32.575
The slope is the number with the x, so the slope is 0.216 and the y- intercept is the number added at the end. The y intercept is 32.575
Ответ:
y-intercept: 32.575
slope: 0.216
Step-by-step explanation:
In y = mx + c
c is the y-intercept
m is the slope
y=0.216x + 32.575
c = 32.575
m = 0.216
Ответ:
50/109
Step-by-step explanation: