
jake2920
04.04.2020 •
Mathematics
The state education commission wants to estimate the fraction of tenth grade students that have reading skills at or below the eighth grade level. Step 2 of 2 : Suppose a sample of 1291 tenth graders is drawn. Of the students sampled, 1098 read above the eighth grade level. Using the data, construct the 95% confidence interval for the population proportion of tenth graders reading at or below the eighth grade level. Round your answers to three decimal places.
Solved
Show answers
More tips
- F Food and Cooking Homemade kvass: recipe and brewing process...
- O Other What is a Disk Emulsifier and How Does it Work?...
- H Health and Medicine How to Calm Your Nerves? Expert Tips That Actually Work...
- A Animals and plants 5 Tips for Taking Care of Yews to Keep Them Green and Beautiful...
- S Sport How to wrap boxing hand wraps? Everything you need to know!...
- F Food and Cooking 10 Reasons Why You Should Avoid Giving Re-Gifts: An Informative Guide...
- F Family and Home Tender Care for Your Parquet: Is it Possible to Clean Parquet?...
- S Style and Beauty How Are Eyelash Extensions Applied? All Your Questions Answered...
- F Food and Cooking 10 Tips for Proper Sushi Consumption...
- S Style and Beauty Learn how to tie a keffiyeh on your head like a pro...
Answers on questions: Mathematics
- M Mathematics Estimate the correlation for this scatterplot. Answer choices: A) -0.95 B) 0.95 C) 0.15 D) -0.35...
- M Mathematics What is the graph of the system y = −2x + 3 and 2x + 4y = −8? Line through point 0, 3 and 1, 1. Line through 0, negative 2 and negative 4, 0. Line through point 0, 3 and...
- M Mathematics Simplify the following expression...
- M Mathematics A dilation followed by a translation maps a pre-image to a similar image? True or False...
- M Mathematics Consider the right triangle shown. Which statements are correct?...
- M Mathematics Answer part a and b....
- M Mathematics Special Quadrilaterals, parallegrams...
- M Mathematics Write the equation of the following table....
- M Mathematics AD and CG are diameters of circle B. Identify each arc as a major arc, minor arc, or semicircle, Arc ACF...
- M Mathematics I need it please I will give 20...
Ответ:
The 95% confidence interval for the population proportion of tenth graders reading at or below the eighth grade level is (0.13, 0.168).
Step-by-step explanation:
In a sample with a number n of people surveyed with a probability of a success of , and a confidence level of
  , we have the following confidence interval of proportions.
In which
z is the zscore that has a pvalue of .
.
For this problem, we have that:
1291 tenth graders, 1098 read above the eighth grade level.
1291 - 1098 = 193 read at or below this level.
We want the 95% confidence interval for the population proportion of tenth graders reading at or below the eighth grade level.
So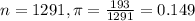
95% confidence level
So , z is the value of Z that has a pvalue of
 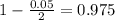 , so
, so  .
.
The lower limit of this interval is:
The upper limit of this interval is:
The 95% confidence interval for the population proportion of tenth graders reading at or below the eighth grade level is (0.13, 0.168).
Ответ:
480-18x=30 25 18-inch sections
Step-by-step explanation: