
saltyclamp
08.12.2019 •
Mathematics
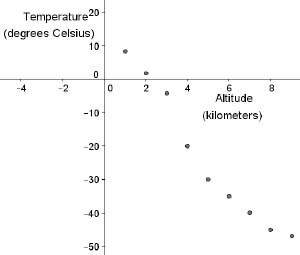
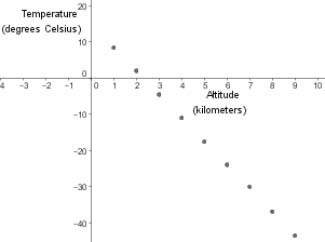
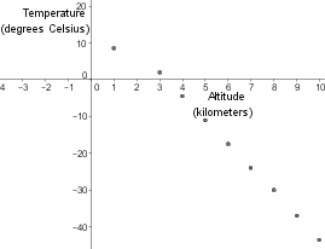
The table below shows the air temperature in degrees celsius at different altitudes in kilometers:
altitude (kilometers) 1 2 3 4 5 6 7 8 9
temperature (degrees celsius) 8.5 2 −4.5 −11 −17.5 −24 −30 −37 −43.5
which scatter plot best represents the data in the table?
a
b
c
d

Solved
Show answers
More tips
- L Leisure and Entertainment How to Choose a Program for Cutting Music?...
- A Auto and Moto How to choose the right drive for your BMW...
- L Leisure and Entertainment How to Choose the Perfect Gift for Men on February 23rd?...
- H Health and Medicine How to Treat Whooping Cough in Children?...
- H Health and Medicine Simple Ways to Lower Cholesterol in the Blood: Tips and Tricks...
- O Other How to Choose the Best Answer to Your Question on The Grand Question ?...
- L Leisure and Entertainment History of International Women s Day: When Did the Celebration of March 8th Begin?...
- S Style and Beauty Intimate Haircut: The Reasons, Popularity, and Risks...
- A Art and Culture When Will Eurovision 2011 Take Place?...
- S Style and Beauty How to Choose the Perfect Hair Straightener?...
Answers on questions: Mathematics
- M Mathematics Asquare has side lengths of 2x inches. an equilateral triangle has side lengths of (2x+1/3) inches. if the square and the triangle have the same perimeter, what is the value of...
- M Mathematics What is the value of x in terms of b -2(bc-5)=16...
- M Mathematics Two perpendicular lines intersect to form four right angles....
- M Mathematics Me. gifford s clase borrows 18 books from tve library. the books are placed in equal stacks on a table. there is more than 1 stack and more than 1 book in each stack. list the...
- M Mathematics Me find the values of a and b so that the system shown had the given solution...
- M Mathematics 17 more than some number is 57...
- M Mathematics Sin(x)/1-cos²(x)=cosec(x)prove it or solve it...
- M Mathematics Figure a is a scale image of figure b the scale that maps figure a onto figure b is 1: 7 1/4 enter the value of xboth figures are trianglesfigure a is smaller than figure bfigure...
- M Mathematics How do you solve this slope y=3x+4 y=3x+7...
- M Mathematics What is sin a? a-24/10 b-10/24 c-24/26 d-10/26...
Ответ:
The difference between temperatures for every increase (1km) in altitude is consistent (6.5), meaning that it is a straight line.
Then, you would have to match the x and y values on the charts to the coordinates on the graph. Ex: (8.5, 1), (2, 2), (-4.5, 3) etc.
Ответ:
Use "Keep, Change, Flip"
32/1 * 6/1
The answer is 192