
tburlew01
20.03.2022 •
Mathematics
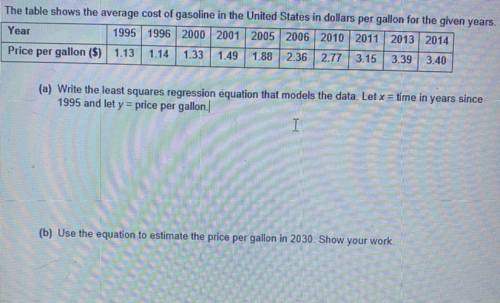
The table shows the average cost of gasoline in the United States in dollars per gallon for the given years.
Year
1995 1996 2000 2001 2005 2006 2010 2011 2013 2014
Price per gallon
($) 1.13 1.14 1.33 1.49 1.88 2362.77 3.15 3.39 3.40
(a) Write the least squares regression equation that models the data. Let x = time in years since
1995 and let y = price per gallon
(b) Use the equation to estimate the price per gallon in 2030. Show your work
Solved
Show answers
More tips
- F Food and Cooking Discover the most delicious spaghetti with these tips...
- P Philosophy How did the concept of module arise in computer science?...
- F Food and Cooking How to Cook Julienne? Recipes and Tips...
- H Health and Medicine At What Age Does a Person Stop Growing?...
- F Family and Home How to Choose a Name for Your Baby?...
- F Food and Cooking Discover the Health Benefits of Cedar Nuts...
- L Leisure and Entertainment Scrapbooking: What is it and Why is it Becoming More Popular?...
- L Leisure and Entertainment Carving: History and Techniques for Creating Vegetable and Fruit Decorations...
- F Food and Cooking How to Make Sushi: A Step-by-Step Guide to Perfectly Rolled Delights...
- T Travel and tourism Maldives Adventures: What is the Best Season to Visit the Luxurious Beaches?...
Answers on questions: Mathematics
- M Mathematics Cual es el recorrido de la luz en un año en notación científica...
- M Mathematics Tighe starts at sea level and hikes up to an elevation of 70 ft. Then he descends(walks down) in the direction of his starting point to an elevation of 30 ft. Tighe says...
- M Mathematics Please show the working . . . Billy ate 5/4 pizzas and John ate 5/3 pizzas. How much more pizza did John eat than Billy?...
- M Mathematics . In an amusement park, the roller coaster ride has been designed in such a way that it starts form 24 m above the ground. The interpolating polynomial is given as: p(x)=−2...
- S Social Studies What are the 2 forms of memory retrieval...
Ответ: