
joannamarquez0701
14.07.2020 •
Mathematics
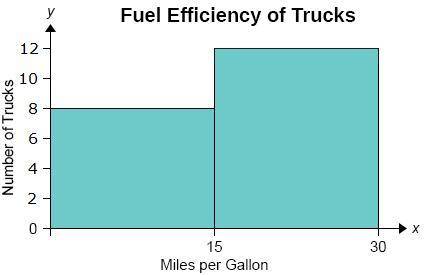
A manufacturer collected the following data on the fuel efficiency of its trucks in miles per gallon. (20, 22, 21, 25, 15, 16, 18, 21, 9, 12, 14, 17, 11, 14, 26, 27, 11, 12, 20, 14) The manufacturer also created a histogram to summarize the data. Explain what’s wrong with the current intervals for the histogram’s bins.
Solved
Show answers
More tips
- P Philosophy Personal attitude towards Confession: how to prepare and undergo the procedure correctly?...
- H Health and Medicine Flu: How to Recognize It by the First Symptoms?...
- F Food and Cooking How to Sober Up Quickly? Important Facts and Tips...
- H Health and Medicine How to Properly Take a Blood Sugar Test?...
- H Health and Medicine Simple and Effective: How to Get Rid of Cracked Heels...
- O Other How to Choose the Best Answer to Your Question on The Grand Question ?...
- L Leisure and Entertainment History of International Women s Day: When Did the Celebration of March 8th Begin?...
- S Style and Beauty Intimate Haircut: The Reasons, Popularity, and Risks...
- A Art and Culture When Will Eurovision 2011 Take Place?...
- S Style and Beauty How to Choose the Perfect Hair Straightener?...
Answers on questions: Mathematics
- M Mathematics - Point K is on line segment JL. Given JK = 3 and KL = 8, determine the length JL....
- M Mathematics Multiply the following polynomials. (x+10)(x+y+2) OPTIONS: 2x+y+20 x^2+12x+10y+xy+20 13x^2+10y+xy+20 12x+10y+xy+12...
- M Mathematics Zani yah wants to buy new shoes. The shoes cost $150 but are on sale for 10% off. How much will Zani yah spend after the discount?...
- M Mathematics Hulu offers two monthly streaming plans. Plan A: $4 per video viewed, plus a flate rate of $5 monthly Plan B: $6 per videa viewed, no additional flate rate a. Write an inequality...
- M Mathematics Help find the value X...
- M Mathematics A rental car company charges $55 plus $0.50 to rent a car Mr.Judd does not want to spend more than 150% for his rental write and solve inequality to find how many miles he can...
- M Mathematics What is the image point of (5, 4) after the transformation R90° 0 Ty-axis?...
- M Mathematics a man earned wages of $42,800, revived $2500 in interest from a savings account, and contributed $3700to a tax deferred retirement plan. he was entitled to a personal exemption...
- M Mathematics Xan 21) The body temperatures of adults are normally distributed with a mean of 98.6°F and a standard deviation of 0.66° F. What temperature represents the 95th percentile?...
- M Mathematics What are the slopes (m1 & m2) to 1.) 3x+6=30 &4y+2x=92.)-x-y=-1 & y+x=7...
Ответ:
D
Step-by-step explanation:
I'm smart ☺ you is to everyone of you'll smart