
lakaralake11
13.03.2020 •
Mathematics
A survey was conducted in the United Kingdom, where respondents were asked if they had a university degree. One question asked, "In the last 20 years the proportion of the world population living in extreme poverty has...", and three choices were provided: 1.)"increased" 2.) "remained more or less the same" and 3.) "decreased". Of 373 university degree holders, 45 responded with the correct decreased; of 639 non-degree respondents, 57 responded with the correct answer1. We would like to test if the percent of correct answers is significantly different between degree holders and non-degree holders. Let group 1 be the degree holders and let group 2 be the non-degree holders.
Solved
Show answers
More tips
- F Food and Cooking What s the Best Rice for Cooking Plov?...
- F Family and Home How to Remove Fading from Clothes: Tips and Tricks...
- F Food and Cooking How to Make Polendwitsa at Home?...
- F Family and Home Parents or Environment: Who Has the Most Influence on a Child s Upbringing?...
- P Philosophy Unbelievable stories of encounters with otherworldly forces...
- L Leisure and Entertainment How to Choose the Perfect Gift for Men on February 23rd?...
- H Health and Medicine How to Treat Whooping Cough in Children?...
- H Health and Medicine Simple Ways to Lower Cholesterol in the Blood: Tips and Tricks...
- O Other How to Choose the Best Answer to Your Question on The Grand Question ?...
- L Leisure and Entertainment History of International Women s Day: When Did the Celebration of March 8th Begin?...
Answers on questions: Mathematics
- M Mathematics The scatterplot shows the average price of a movie ticket, y, over the last 20 years. 10 (20, 8.40) *(12, 6.80) Average Ticket Price ($) .(3, 5.00) (0, 4.40) O2 6 8 10 12 14...
- M Mathematics The office building is 48 floors high. each floor has 36 windows. how many windows does the building have in all...
- M Mathematics Solve the system of equations using gaussian elimination or gauss-jordan elimination. 1. 2x+y=1 3x-6y=4 2. 5x-3y=-2 4x+2y=5...
- M Mathematics In 1950, the population of a city was about 800,000 people. over the next 50 year, the population increased to 1.3 million.find the percent of increase...
- M Mathematics Sara was sitting in a seat at a baseball game when another ticket holder showed her she was in the wrong seat. the other ticket holder kindly told sarah she needed to go five...
- M Mathematics How do it and give me example in number one only plz is my homework...
- M Mathematics Suppose that 23% of the people have a dog, 18% of the people have a cat and 5% of people own both. what is the probability that someone owns a dog or a cat ?...
- M Mathematics What is the prime factorization of 160?...
- M Mathematics The cooks in the cafeteria made a total of 96 sandwiches. they made 4 ham sandwiches for every 6 turkey sandwiches. how many more turkey sandwhiches. than ham sandwhiches did...
- M Mathematics Suppose u = {1, 2, 3, 4, 5, 6, 7, 8, 9, 10} is the universal set, and p = {1, 3, 5, 7, 9}. what is...
Ответ:
If we compare the p value and using any significance level for example always
  so we can conclude that we have enough evidence to FAIL to reject the null hypothesis, and we can say the the two proportions are not statistically different at 5% of significance
Step-by-step explanation:
Data given and notation
z would represent the statistic (variable of interest)
Concepts and formulas to use
We need to conduct a hypothesis in order to check if the proportions are different between the two groups, the system of hypothesis would be:
Null hypothesis:
Alternative hypothesis:
We need to apply a z test to compare proportions, and the statistic is given by:
Where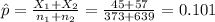
Calculate the statistic
Replacing in formula (1) the values obtained we got this:
Statistical decision
For this case we don't have a significance level provided , but we can calculate the p value for this test.
Since is a one side test the p value would be:
If we compare the p value and using any significance level for example always
  so we can conclude that we have enough evidence to FAIL to reject the null hypothesis, and we can say the the two proportions are not statistically different at 5% of significance
Ответ:
Hope I helped:D