
shawn20034
28.09.2019 •
Mathematics
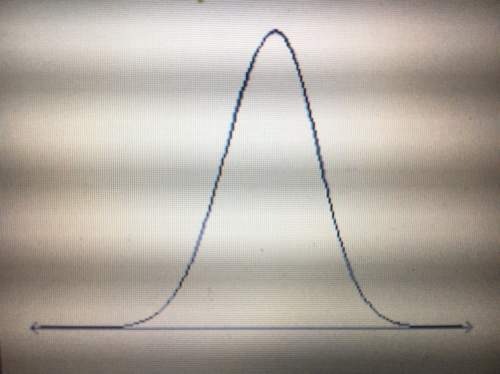
Answer fast ! the distribution of the values of a population is shown below, and a simple random sample is drawn from the population. based on this information alone, can the sample be used to make inferences about the population?
a. no, because the population values appear to be normally distributed.
b. no, because the population values do not appear to be normally distributed.
c. yes, because the population values appear to be normally distributed.
d. yes, because the population values do not appear to be normally distributed.
(i think it might be "b" but i'm not sure)
Solved
Show answers
More tips
- S Society and Politics Выборы: Смысл, Значение и Отражение...
- L Leisure and Entertainment History of International Women s Day: When Did the Celebration of March 8th Begin?...
- S Style and Beauty Intimate Haircut: The Reasons, Popularity, and Risks...
- A Art and Culture When Will Eurovision 2011 Take Place?...
- S Style and Beauty How to Choose the Perfect Hair Straightener?...
- F Family and Home Why Having Pets at Home is Good for Your Health...
- H Health and Medicine How to perform artificial respiration?...
- H Health and Medicine 10 Tips for Avoiding Vitamin Deficiency...
- F Food and Cooking How to Properly Cook Buckwheat?...
- F Food and Cooking How Many Grams Are In a Tablespoon?...
Answers on questions: Mathematics
- M Mathematics I don t understand the question correctly..can someone tell me what should I do here plz?...
- M Mathematics (x) = x2 + 5x - 1 is shifted 3 units left. The result is g(x). What is g(x)? O A. dx) = (x+3)2 + 5x-1 O B. (X) = (x+ 3)2 + 5(x+3) - 1 O c. ox) = x2 + 5x+2 O d. g(x) =...
- M Mathematics Ursula hiked 6 1/2 kilometers through the woods. How many decímeters did she hike ?...
- M Mathematics The skid marks for a car involved in an accident measured 54ft. Use the formula s=24d‾‾‾‾√ to find the speed, s, in feet per second, of the car before the brakes were...
- M Mathematics The graph of a sinusoidal function has a max point (0,8) and min point (5,2) whats the formula...
- M Mathematics Trouble answering this...
- M Mathematics The farmer need to build a rectangle with the L being 10 and the and it all being 50. What s the W. A 50...
- M Mathematics P =-12 what is the value of p...
- M Mathematics What percent of $5x$ is equal to $x/5$?...
- M Mathematics Gina divided the figure below in rectangles to help determine its area. all measurements are in inches....
Ответ:
Ответ:
C. Yes, because the population values appear to be normally distributed.
Step-by-step explanation:
Given is a graph which shows the distribution of values of a population
The graph has the following characteristics
i) Bell shaped
ii) symmerical about mid vertical line
iii) Unimodal with mode = median =mean
iv) As x deviates more from the mean probability is decreasing and also curve approaches asymptotically the x axis
Hence we find that the curve is a distribution of normal
Option C is right
C. Yes, because the population values appear to be normally distributed.
Ответ: