
suzyleonardsl0
15.10.2020 •
Mathematics
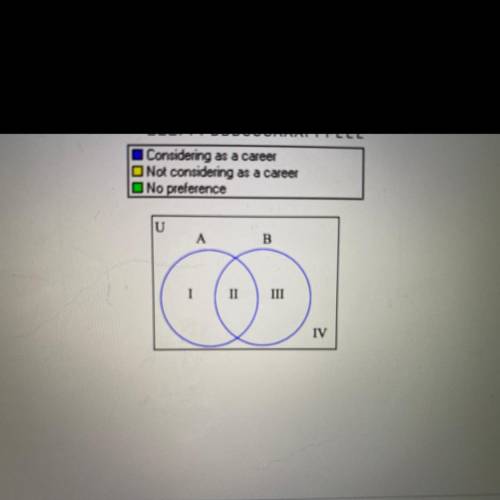
The bar graph on the right shows the percentage of students at a local high school with preferences for
various careers, Career E is elementary school teacher, P is police officer, B is banker, S is surgeon, A is
airline pilot, F is family doctor, and L is lawyer. Use the graph to place the airline pilot career in the correct
region of the Venn diagram, also on the right, where U is the set of careers, A is the set of careers for
which more than 20% of students are considering as a career, and B is the set of careers for which more
than 20% of students are not considering as a career.
In which region does the airline pilot career belong?
Solved
Show answers
More tips
- F Food and Cooking How to Cook Julienne? Recipes and Tips...
- D Dating, Love, Relationships 10 Useful Tips on How to Survive a Breakup?...
- F Food and Cooking Apple Cider Vinegar: The Ultimate Health and Beauty Solution...
- C Computers and Internet Е-head: How it Simplifies Life for Users?...
- F Family and Home How to Choose the Best Diapers for Your Baby?...
- F Family and Home Parquet or laminate, which is better?...
- L Leisure and Entertainment How to Properly Wind Fishing Line onto a Reel?...
- L Leisure and Entertainment How to Make a Paper Boat in Simple Steps...
- T Travel and tourism Maldives Adventures: What is the Best Season to Visit the Luxurious Beaches?...
- H Health and Medicine Kinesiology: What is it and How Does it Work?...
Answers on questions: Mathematics
- M Mathematics If the radius of a circle is 11, what is the area and circumference? Thanks :)...
- M Mathematics please help, i asked this question on here before and the person that answered was incorrect and i failed the assignment. the teacher is giving me the chance to do it again... please...
- M Mathematics The following table shows the input and output values of the function y=-4x+5. Input Output -1 9 0 5 2. -3 4 -11 5 -15 Find the values of the domain...
- M Mathematics There is no more then 18 students in the hall...
- M Mathematics Does the order pair (1,8) satisfy the function y=3x+6 Yes,No...
- M Mathematics Three angles are described as follows: ∠ is half the size of ∠. The measure of ∠ is equal to one less than two times the measure of ∠. The sum of ∠ and ∠ is 114°. Can the three angles...
- M Mathematics Chris wrote an equation and the first step of his solution process, as shown. 6 = 12 − 6x -6 = -6x Which math operation did Chris apply in his first step? A) He divided 16 by 4. B)...
- M Mathematics Daniel took a test worth 250 points . There were 48 questions on the test . Some questions were worth five points with the remainder of the questions worth eight points . 1. Write...
- M Mathematics A teacher reaches into a bag of game pleces containing 5 black pleces, 3 purple pleces, 1 orange plece, and 6 green pleces, He draws 2 pleces, setting aside the first plece before...
- M Mathematics 4 book cases weigh the same amount and the total for all of them is 134 lbs how much does each bookcase weigh?...
Ответ:
its 23
Step-by-step explanation: