
whocares1234
16.04.2020 •
Mathematics
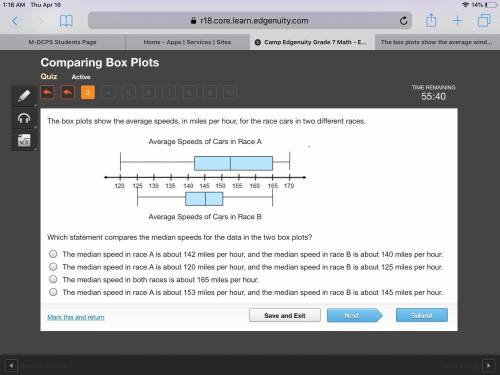
The box plots show the average speeds, in miles per hour, for the race cars in two different races.
Average Speeds of Cars in Race A
2 box plots. The number line goes from 120 to 170. For Race A, the whiskers range from 120 to 170, and the box ranges from 143 to 165. A line divides the box at 153. For Race B, the whiskers range from 125 to 165, and the box ranges from 140 to 150. A line divides the box at 145.
Average Speeds of Cars in Race B
Which statement compares the median speeds for the data in the two box plots?
The median speed in race A is about 142 miles per hour, and the median speed in race B is about 140 miles per hour.
The median speed in race A is about 120 miles per hour, and the median speed in race B is about 125 miles per hour.
The median speed in both races is about 165 miles per hour.
The median speed in race A is about 153 miles per hour, and the median speed in race B is about 145 miles per hour.
Solved
Show answers
More tips
- F Food and Cooking The Health Benefits of Flaxseed oil...
- S Style and Beauty Why is Sugaring Better than Waxing for Hair Removal?...
- W Work and Career Where can you learn to be a flight attendant?...
- G Goods and services How to Properly Calculate the Power of Your Air Conditioner?...
- F Food and Cooking Effective Methods to Organize Videos in your iPad According to Content...
- F Family and Home Parquet or laminate, which is better?...
- L Leisure and Entertainment How to Properly Wind Fishing Line onto a Reel?...
- L Leisure and Entertainment How to Make a Paper Boat in Simple Steps...
- T Travel and tourism Maldives Adventures: What is the Best Season to Visit the Luxurious Beaches?...
- H Health and Medicine Kinesiology: What is it and How Does it Work?...
Answers on questions: Mathematics
- M Mathematics Explain to me how to solve these and the answer to these small math question 16 ponits given the function, y = 3x, what are the y values when x=0, x=1/3, and x = 10? 0, 9, 30...
- M Mathematics If you have 54 blue marbles and 99 yellow marbles, what is the greatest number of identical marble bags that can be made without any marbles leftover? a) 6 b) 9 c) 12 d) 18...
- M Mathematics If a company sells a 20lb bag of soil for $8, how much can you get for $1?...
- M Mathematics Ashelf can support 3 and 3/4 pounds . if a book weights 3/8 of a pound, how many books can the shelf hold?...
- M Mathematics If the sales for the week are $5,600, what is her total income?...
- M Mathematics Aright triangle has an area of 18 square inches if the triangle is not an isosceles triangle what are all possible lengths of the legs if the lengths are whole numbers?...
- M Mathematics The national weather service keeps track of the temperature for a given day in a given city. it also keeps track of this information at certain times during a given day. the...
- M Mathematics If tan of angle theta = 11/60 , what is the value of cot angle theta?...
- M Mathematics Which of the following is polynomial?...
- M Mathematics Write the fact family for 5,8,and 40...
Ответ:
I don't know.
Step-by-step explanation: