
mrfishyyyy
08.02.2021 •
Mathematics
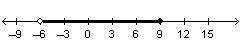
Which graph represents the solution to the compound inequality?
–6 < 3x – 12 ≤ 9


Solved
Show answers
More tips
- F Food and Cooking How to Make Napoleon Cake: A Step-by-Step Guide...
- H Health and Medicine How to Increase Hemoglobin in the Blood...
- F Food and Cooking How to Make Chebureki: A Delicious Recipe for Russian Street Food...
- S Style and Beauty Ultimate Guide on How to Care for Suede Shoes...
- T Travel and tourism How to Use a Compass: A Beginner s Guide...
- D Dating, Love, Relationships Does a Person s Character Depend on the Color of Their Eyes?...
- F Food and Cooking Is it Really Possible to Cook Tasty Colored Cauliflower?...
- H Health and Medicine Why do our Joints Crack?...
- H Health and Medicine These Food Additives Can Do Significant Harm to Your Health...
- F Food and Cooking How to Choose the Right Olive Oil: A Comprehensive Guide...
Answers on questions: Mathematics
- M Mathematics de que otra forma podria obtener la expresion decimal de una.fraccion con denominador 10 , 100 , 1000 etc...
- H History Create at least three sentences using cause-and-effect. List at least three key political developments in medieval Europe. Then, for each development, use the words led to and...
- M Mathematics T-7= -1 what is t in this equation...
- C Computers and Technology Sign that your desktop may need cleaning...
- E English Disaster-Film Proposal How would you turn this suspenseful story into a disaster movie? Write a three- to four-paragraph proposal for a film based on Rogue Wave. Include each of...
Ответ:
second graph
Step-by-step explanation:
Solving the inequality
- 6 < 3x - 12 ≤ 9 ( add 12 to all 3 intervals )
6 < 3x ≤ 21 ( divide the intervals by 3 )
2 < x ≤ 7
The graph has an open circle at 2 and a closed circle at 7
This is represented on the second graph
Ответ:
Your answer is
196