
anggar20
30.12.2020 •
Mathematics
A consumer group is testing camp stoves. To test the heating capacity of a stove, they measure the time required to bring 2 quarts of water from 50 degrees to boiling.
Two competing models are under consideration. Thirty-six stoves of each model were tested and the following results were obtained.
Model 1: mean time is 11.4 and standard deviation is2.5
Model 2: mean time is 9.9 and standard deviation is 3.0
Is there any difference between the performances of these two models? {use a .05 level of significance}. Find the p-value of the sample statistic and do a significance test.
Find a 95% confidence interval for the difference of the means.
Solved
Show answers
More tips
- A Animals and plants How to Store Carrots: Tips for Homeowners...
- L Legal consultation Juvenile Justice: Who Needs It?...
- F Family and Home How to Choose the Best Diapers for Your Baby?...
- F Family and Home Parquet or laminate, which is better?...
- L Leisure and Entertainment How to Properly Wind Fishing Line onto a Reel?...
- L Leisure and Entertainment How to Make a Paper Boat in Simple Steps...
- T Travel and tourism Maldives Adventures: What is the Best Season to Visit the Luxurious Beaches?...
- H Health and Medicine Kinesiology: What is it and How Does it Work?...
- O Other How to Choose the Best Answer to Your Question on The Grand Question ?...
- L Leisure and Entertainment History of International Women s Day: When Did the Celebration of March 8th Begin?...
Answers on questions: Mathematics
- M Mathematics If A is in the fourth quadrant and cos A = 5/13 , find the value of (13 sin A +5secA)/(3tanA+6 cosecA)...
- M Mathematics Seven of 200 digital video recorders DVR in an inventory are known to be defective...
- M Mathematics Please give the best explanation that you can Thank you!...
- M Mathematics 8-2x=5-4x 4+3x=2-2x 2(x-1)+2(3x-1)=0...
- M Mathematics Can somebody help me Please....
- M Mathematics THE FIGURE BELOW REPRESENTS A RIGHT PYRAMID. ON A SQUARE BASE 3cm,THE SLANT EDGE IS 4cm b)CALCULATE THE SURFACE AREA OF THE PYRAMID...
- M Mathematics Help me Will mark brainliest...
- M Mathematics If the equation of the line y=-5x+7 is changed to y=5x+7, how does the graph change?...
- M Mathematics Math pls patulong You are a bank financier. Your bank pays an annual interest rate of 3% compounded quarterly. If the initial deposit (or principal), of your client is Php 50...
- M Mathematics The sum of two numbers is 40. The larger number is 8 more than the smaller number. What are the numbers?...
Ответ:
a
The decision rule is
Reject the null hypothesis
The conclusion is
There is sufficient evidence to show that there is a difference between the performances of these two models
b
The 95% confidence interval is
Step-by-step explanation:
From the question we are told that
The sample size is n = 36
The first sample mean is
The first standard deviation is
The second sample mean is
The second standard deviation is
The level of significance is
The null hypothesis is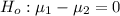
The alternative hypothesis is
Generally the test statistics is mathematically represented as
=>
=>
From the z table the area under the normal curve to the left corresponding to 2.3 is
Generally the p-value is mathematically represented as
=>
=>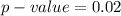
From the value obtained we see that hence
hence
The decision rule is
Reject the null hypothesis
The conclusion is
There is sufficient evidence to show that there is a difference between the performances of these two models
Considering question b
From the question we are told the confidence level is 95% , hence the level of significance is
=>
Generally from the normal distribution table the critical value of is
is
Generally the margin of error is mathematically represented as
=>
=>
Generally 95% confidence interval is mathematically represented as
=>
=>
Ответ:
2.