
wtwbegay
30.01.2020 •
Mathematics
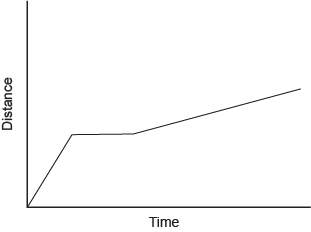
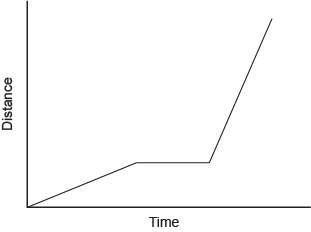
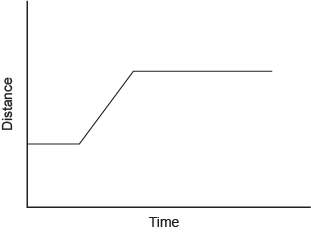
Arunner ran at a steady rate, stopped to retie their shoes, and then ran at a steady rate again, this time slower than they ran before stopping to tie their shoes.
which graph represents this situation?
the pictures are in order

Solved
Show answers
More tips
- A Animals and plants How to Store Carrots: Tips for Homeowners...
- L Legal consultation Juvenile Justice: Who Needs It?...
- F Family and Home How to Choose the Best Diapers for Your Baby?...
- F Family and Home Parquet or laminate, which is better?...
- L Leisure and Entertainment How to Properly Wind Fishing Line onto a Reel?...
- L Leisure and Entertainment How to Make a Paper Boat in Simple Steps...
- T Travel and tourism Maldives Adventures: What is the Best Season to Visit the Luxurious Beaches?...
- H Health and Medicine Kinesiology: What is it and How Does it Work?...
- O Other How to Choose the Best Answer to Your Question on The Grand Question ?...
- L Leisure and Entertainment History of International Women s Day: When Did the Celebration of March 8th Begin?...
Answers on questions: Mathematics
- M Mathematics Which expression illustrates the associative property of addition? (3 + 19) – 12 = (3 + 12) – 19 3 + (19 – 12) = 3 + (19 + 12) (3 + 19) – 12 = 3 + (19 – 12) 3 + (19 –12) =...
- B Business Table 13-11 measures of cost for very brady poster factory quantity of posters variable costs total costs fixed costs 0 $10 1 $1 2 $3 $13 3 $6 $16 4 $10 5 $25 6 $21 $10 refer...
- M Mathematics Appliances unlimited (au) sells refrigerators. any refrigerator that fails before it is three years old is replaced for free. of all refrigerators, 2% fail during their first...
- M Mathematics statistics homework please help !!!...
- S Social Studies When dr. r. carson is asked to explain troubled adolescents, she says, the only way to explain the problems of adolescents is to study them in relation to their parents and...
Ответ:
The runner goes a lot of distance in a short amount of time (Demonstrated by the steep incline of the first portion). When the runner is tying their shoe, the distance remains the same, thus eliminating the second graph and the last graph because the last graph doesn't show the beginning of the problem. Finally, we know that the runner is slower after tying their shoe, this means the incline of the line would be far less as steep (Meaning the slope would be smaller). The only graph that depicts all of these, is the first one.
I Hope this Helps!
-Sinnamin
Ответ:
Family 28oz is the best buy